Java is becoming new C/C++ , it is extensively used in developing High Performance System.
Good for millions of Java developer like me:-)
In this blog i will share my experiment with different types of memory allocation that can be done in java and what type of benefit you get with that.
Memory Allocation In Java
What type of support Java provide for memory allocation
- Heap Memory
I don't i have to explain this, all java application starts with this. All object allocated using "new" keyword goes under Heap Memory
- Non Direct ByteBuffer
It is wrapper over byte array, just flavor of Heap Memory.
ByteBuffer.allocate() can be used to create this type of object, very useful if you want to deal in terms of bytes not Object.
- Direct ByteBuffer
This is the real stuff that java added since JDK 1.4.
Description of Direct ByteBuffer based on Java Doc
"A direct byte buffer may be created by invoking the allocateDirect factory method of this class. The buffers returned by this method typically have somewhat higher allocation and deallocation costs than non-direct buffers. The contents of direct buffers may reside outside of the normal garbage-collected heap, and so their impact upon the memory footprint of an application might not be obvious. It is therefore recommended that direct buffers be allocated primarily for large, long-lived buffers that are subject to the underlying system's native I/O operations. In general it is best to allocate direct buffers only when they yield a measureable gain in program performance."
Important thing to note about Direct Buffer is
- It is Outside of JVM
- Free from Garbage Collector reach.
These are very important thing if you care about performance.
MemoryMapped file are also flavor of Direct byte buffer, i shared some of my finding with that in below blogs
arraylist-using-memory-mapped-file
power-of-java-memorymapped-file
- Off Heap or Direct Memory
This is almost same as Direct ByteBuffer but with little different, it can be allocated by unsafe.allocateMemory, as it is direct memory so it creates no GC overhead. Such type of memory must be manually released.
In theory Java programmer are not allowed to do such allocation and i think reason could be
- It is complex to manipulate such type of memory because you are only dealing with bytes not object
- C/C++ community will not like it :-)
Lets take deep dive into memory allocation
For memory allocation test i will use 13 byte of message & it is broken down into
- int - 4 byte
- long - 8 byte
- byte - 1 byte
I will only test write/read performance, i am not testing memory consumption/allocation speed.
Write Performance

X Axis - No Of Reading
Y Axis - Op/Second in Millions
5 Million 13 bytes object are written using 4 types of allocation.
Direct ByteBuffer & Off Heap are best in this case, throughput is close to 350 Million/Sec
Normal ByteBuffer is very slow, TP is just 85 Million/Sec
Direct/Off Heap is around 1.5X times faster than heap
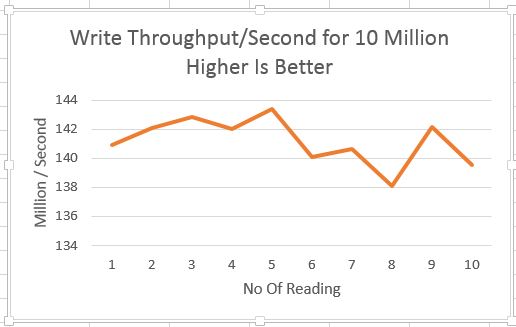
I did same test with 50 Million object to check how does it scale, below is graph for same.

X Axis - No Of Reading
Y Axis - Op/Second in Millions
Numbers are almost same as 5 Million.
Read Performance
Lets look at read performance

X Axis - No Of Reading
Y Axis - Op/Second in Millions
This number is interesting, OFF heap is blazing fast throughput for 12,000 Millions/Sec :-)
Only close one is HEAP read which is around 6X times slower than OFF Heap.
Look at Direct ByteBuffer , it is tanked at just 400 Million/Sec, not sure why it is so
Lets have look at number for 50 Million Object

X Axis - No Of Reading
Y Axis - Op/Second in Millions
Not much different.
Conclusion
Off heap via Unsafe is blazing fast with 330/11200 Million/Sec.
Performance for all other types of allocation is either good for read or write, none of the allocation is good for both.
Special note about ByteBuffer, it is pathetic , i am sure you will not use this after seeing such number.
DirectBytebuffer sucks in read speed, i am not sure why it is so slow
So if memory read/write is becoming bottle neck in your system then definitely Off-heap is the way to go, remember it is highway, so drive with care.
Code is available @ git hub
Update
Fixing broken code link - code available at github
Good for millions of Java developer like me:-)
In this blog i will share my experiment with different types of memory allocation that can be done in java and what type of benefit you get with that.
Memory Allocation In Java
What type of support Java provide for memory allocation
- Heap Memory
I don't i have to explain this, all java application starts with this. All object allocated using "new" keyword goes under Heap Memory
- Non Direct ByteBuffer
It is wrapper over byte array, just flavor of Heap Memory.
ByteBuffer.allocate() can be used to create this type of object, very useful if you want to deal in terms of bytes not Object.
- Direct ByteBuffer
This is the real stuff that java added since JDK 1.4.
Description of Direct ByteBuffer based on Java Doc
"A direct byte buffer may be created by invoking the allocateDirect factory method of this class. The buffers returned by this method typically have somewhat higher allocation and deallocation costs than non-direct buffers. The contents of direct buffers may reside outside of the normal garbage-collected heap, and so their impact upon the memory footprint of an application might not be obvious. It is therefore recommended that direct buffers be allocated primarily for large, long-lived buffers that are subject to the underlying system's native I/O operations. In general it is best to allocate direct buffers only when they yield a measureable gain in program performance."
Important thing to note about Direct Buffer is
- It is Outside of JVM
- Free from Garbage Collector reach.
These are very important thing if you care about performance.
MemoryMapped file are also flavor of Direct byte buffer, i shared some of my finding with that in below blogs
arraylist-using-memory-mapped-file
power-of-java-memorymapped-file
- Off Heap or Direct Memory
This is almost same as Direct ByteBuffer but with little different, it can be allocated by unsafe.allocateMemory, as it is direct memory so it creates no GC overhead. Such type of memory must be manually released.
In theory Java programmer are not allowed to do such allocation and i think reason could be
- It is complex to manipulate such type of memory because you are only dealing with bytes not object
- C/C++ community will not like it :-)
Lets take deep dive into memory allocation
For memory allocation test i will use 13 byte of message & it is broken down into
- int - 4 byte
- long - 8 byte
- byte - 1 byte
I will only test write/read performance, i am not testing memory consumption/allocation speed.
Write Performance

X Axis - No Of Reading
Y Axis - Op/Second in Millions
5 Million 13 bytes object are written using 4 types of allocation.
Direct ByteBuffer & Off Heap are best in this case, throughput is close to 350 Million/Sec
Normal ByteBuffer is very slow, TP is just 85 Million/Sec
Direct/Off Heap is around 1.5X times faster than heap
I did same test with 50 Million object to check how does it scale, below is graph for same.

X Axis - No Of Reading
Y Axis - Op/Second in Millions
Numbers are almost same as 5 Million.
Read Performance
Lets look at read performance

X Axis - No Of Reading
Y Axis - Op/Second in Millions
This number is interesting, OFF heap is blazing fast throughput for 12,000 Millions/Sec :-)
Only close one is HEAP read which is around 6X times slower than OFF Heap.
Look at Direct ByteBuffer , it is tanked at just 400 Million/Sec, not sure why it is so
Lets have look at number for 50 Million Object

X Axis - No Of Reading
Y Axis - Op/Second in Millions
Not much different.
Conclusion
Off heap via Unsafe is blazing fast with 330/11200 Million/Sec.
Performance for all other types of allocation is either good for read or write, none of the allocation is good for both.
Special note about ByteBuffer, it is pathetic , i am sure you will not use this after seeing such number.
DirectBytebuffer sucks in read speed, i am not sure why it is so slow
So if memory read/write is becoming bottle neck in your system then definitely Off-heap is the way to go, remember it is highway, so drive with care.
Code is available @ git hub
Update
Fixing broken code link - code available at github