Saturday 26 May 2018

Custom Logs in Apache Spark

Have you ever felt the frustration of Spark job that runs for hours and it fails due to infra issue.
You know about this failure very late and waste couple of hours on it and it hurts more when Spark UI logs are also not available for postmortem.

You are not alone!

In this post i will go over how to enable your own custom logger that works well with Spark logger.
This custom logger will collect what ever information is required to go from reactive to proactive monitoring.
No need to setup extra logging infra for this.

Spark 2.X is based using Slf4j abstraction and it is using logback binding.

Lets start with logging basic, how to get logger instance in Spark jobs or application.

val _LOG = LoggerFactory.getLogger(this.getClass.getName)

It is that simple and now your application is using same log lib and settings that Spark is based on.

Now to do something more meaningful we have to inject our custom logger that will collect info and write it to Elastic search or Post to some REST endpoint or sends alerts.

lets go step by step to do this

Build custom log appender
Since spark 2.X is based on logback, so we have to write logback logger.

Code snippet for custom logback logger

This is very simple logger which is counting message per thread and all you have to do it override append function.

Such type of logger can do anything like writing to database or sending to REST endpoint or alerting .

Enable logger
For using new logger, create logback.xml file and add entry for new logger.
This file can be packed in Shaded jar or can be specified as runtime parameter.

Sample logback.xml
This config file adding MetricsLogbackAppender as METRICS
<appender name="METRICS" class="micro.logback.MetricsLogbackAppender"/>

Next enabling it for package/classes that should use this
<logger level="info" name="micro" additivity="true">    <appender-ref ref="METRICS" /></logger>
<logger level="info" name="org.apache.spark.scheduler.DAGScheduler" additivity="true">    <appender-ref ref="METRICS" /></logger>

You are done!

Any message logged from 'micro' package or from DAGScheduler class will be using new logger .
Using this technique executor logs can be also capture and this becomes very useful when spark job is running on hundred or thousands of executor.

Now it opens up lots of option of having BI that shows all these message at real time, allow team to ask interesting questions or subscribe to alters when things are not going well.

Caution : Make sure that this new logger is slowing down application execution, making it asynchronous is recommended.

Get the insight at right time and turn it to action

Code used in this blog is available @ sparkmicroservices repo in github.

I am interested in knowing what logging patterns you are using for Spark.

Spark Microservices

As continuation of big data query system blog, i want to share more techniques for building Analytics engine.

Take a problem where you have to build system that will be used for analyzing customer data at scale.

What options are available to solve this problem ?
 - Load the data in your favorite database and have right indexes.
   This works when data is small, when i say small less then 1TB or even less.

 - other option is to use something like elastic search 
Elastic search works but it comes up with overhead of managing another cluster and shipping data to elastic search

 -use spark SQL or presto 
Using these for interactive query is tricky because of minimum overhead that is required to execute query can be more than latency required for query which could be 1 or 2 sec.

 -use distributed In-Memory database. 
This looks good option but it also has some issues like many solution is proprietary and open source one will have overhead similar to Elastic Search.

 - Spark SQL by removing Job start overhead.
I will deep dive in to this option. Spark has become number one choice for build ETL pipeline because of simplicity and big community support and Spark SQL can connect to any data source ( JDBC,Hive ,ORC, JSON, Avro etc).

Analytics query generate different type of load, it only needs few columns from the whole set and executes some aggregate function over it, so column based database will make good choice for analytics query.

Apache Parquet is a columnar storage format available to any project in the Hadoop ecosystem, regardless of the choice of data processing framework, data model or programming language.
So using Spark data can converted to parquet and then Spark SQL can be used on top of it to answer analytics query.

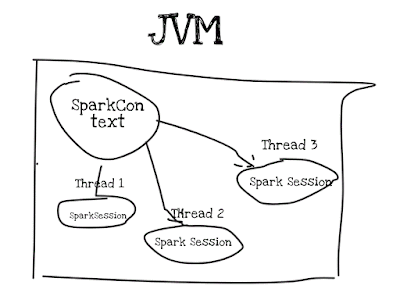
To put all in context convert HDFS data to parquet(i.e column store), have a micro services that will open Sparksession  , pin data in memory and keep spark session open forever just like database pool connection.

Connection pool is more than decade old trick and it can be used for spark session to build analytics engine.

High level diagram on how this will look like

Spark Session is thread safe, so no need to add any locks/synchronization.
Depending on use case single or multiple  spark context can be created in single JVM.


Spark 2.X has simple API to create singleton instance for SparkContext and handles thread based SparkSession also.
Code snippet for creation spark session


Caution
All this works fine if you have micro service running on single machine but if this micro service is load balanced then each instance will have one context.
If single spark context requests for thousands of cores then some strategy is required to load balancing Spark context creation. This is same as database pool issue, you can only request for resource that is physically available.

Another thing to remember that now driver is running in web container so allocate proper memory to process so that web server does not blow up with out of memory error.

I have create micro services application using Spring boot and it is hosting Spark Session session via Rest API.

This code has 2 types of query
 - Single query per http thread
 - Multiple query per http thread. This model is very powerful and can be used for answering complex query.

Code is available on github @ sparkmicroservices

Wednesday 9 May 2018

Design pressure on engineering team ?

How many time you are supporting or developing system and felt it could have been better designed.


Move fast and break things culture in software has allowed engineering team to get product early to market but has created huge Tech Debt that team has struggled to come over.

Engineering team is put under feature pressure to get the things done and other important things are left as nice to have.
Important things in system are put as "Non Functional" requirement but in reality these are the requirement that are must for system to be functional in long run.

In real engineering project like civil engineering people are trained to think about 
  • What material to use ?
  • How many people it can accommodate ?
  • When maintenance must happen ?
  • Where are the emergency exit ? 
  • How to evacuate in case of emergency ? 

But many Software system are build without thinking about basic Operations or Support requirement.

Software development has become trend or resume driven to use machine learning, Deep learning, latest java script , latest NO-SQL or Stream processing,Blockchain etc.

These cutting edge fails to delivery to basic engineering needs if no upfront thought is put in.

As a software engineer we have to think about Design Pressure as first thing. What are these design pressure ?

  • How service executes ?
  • What load it can handle ?
  • It is possible to run it on developer laptop ?
  • Is it possible to debug it ?
  • Does it support automated packaging or deployment ?
  • Is it testable or maintainable ?
  • Separation of concerns ?
  • Can you observe system from outside ?
  • Does system has pipeline or chokeline architecture 
  • What are system dependency or it needs whole world
  • Does it capture metrics or you have to make a guess.
  • Does it fit in your HEAD or you need BIG head or multiple HEAD

These are things that are very difficult and expensive to add later.

The reason why we don't look at these things first is because "We get bored" or "We like complex" or "We want to copy what google or facebook does"

Not every company has problem that google or facebook is facing so we should be careful in picking tools/tech that is used by big internet company.

I want to end with with "tale of two value" of software system.

Behavior 

Software developer are hired to build new features and stakeholders work closely to get this thing implemented. This is the "what" part of Software.

Architecture

If this part is done properly then Software remains "Soft" or it becomes Big ball of mud.
This is "How" part and engineer has to take all the responsibility of this. 


Both the value of system are important and urgent, but more focus is put on behavior because it becomes Urgent as soon as project starts.

If we ignore "Design Pressure" then system will become costly to develop & making changes will be impossible.

Let me know about your experience with Design pressure 

Saturday 5 May 2018

OS tools for java performance monitoring

In this blog i will go through some of the Unix OS tools that can be used to monitor health of application.

Lets first define what is performance monitoring before we get to tools.

Performance monitoring is steps of collecting performance data from running application or operating system. Upfront monitoring is reactive step where development team try to identify bottle neck before it reported by customers.

There are couple of things that can be become bottle neck
  • CPU
  • Memory
  • Disk/IO
  • Network
  • System Calls

Unix has lots of tools that will help in looking at above parameters. Lets start

Monitor CPU usage

Some basic info is required before you start looking at CPU profiling
  • Number of virtual cores
  • CPU frequency
  • Current speed at which it is running etc
  • or want to set to specific frequency before testing.
cpufreq-info is the good tool to start with, it has every thing that is required.

top is number 1 tool that is used to monitor CPU usage of system, it produces ordered list of running process and updates it periodically. It shows which process is consuming most resource. Some time top can be listed as top process!


Top Command output


It has 2 sections
  • Total CPU usage, memory usage
  • Individual process usage.
top works on snapshot, so there is a chance that problematic application might not get listed if it generates load between snapshots and top it self is very resource consuming. This is classic problem with any profiling tools.

Other better and light weight options are Htop, which is graphical and shows much more information.
It has info about which cores are busy, in this sample core number 5 is very busy.

Htop Output


top/Htop will highlight CPU intensive application, now next interesting thing to know will what is load on CPU scheduler.


This takes us to another tool Vmstat

vmstat tool display summary information about operating system memory, processes, interrupts, paging and block I/O.
VM Stat output

vmstat has few sections like "procs", this section will help in figuring out if system is saturated with work.
"r" - Shows run queue, how many threads are ready to run but waiting for CPU to schedule it.
"b" - Shows block/sleep queue, threads that are in uninterruptible sleep.

High value for run queue is indication that system is saturated, value should not be more than number of virtual cores available. Execute TopApplication to see CPU saturation.

There are couple of ways to fix this issues
  • Get more CPU, if possible.
  • Reduce number of active threads
  • Identify the hotspot in code and fix it.

Monitor CPU - Context Switch

Next comes pidstat, it shows individual process level details like threads, I/O, context switch, memory usage , page fault etc

pidstat -t -d -r -w -h -p <pid> 5

t - Thread associated with task
d - Disk activity
r - Page fault & memory usage
w - Context switch

Context switches are very expensive and it is one of the top reason why all Cores are not fully used. vmstat shows context switch but it is across all cores.

Output from vmstat, 5th column from right shows context switch.

ashkrit@ashkrit-Inspiron-7520:~$ vmstat 5
procs -----------memory---------- ---swap-- -----io---- -system-- ------cpu-----
 r  b   swpd   free   buff  cache   si   so    bi    bo   in   cs us sy id wa st
 0  0      0 2840132  90168 1793480    0    0    22    17  269  670  9  2 89  0  0
 1  0      0 2828648  90168 1803420    0    0     0    94 1711 4833  2  1 97  0  0
 0  0      0 2839472  90192 1793148    0    0     0    36 1227 3403  1  1 98  0  0
 1  0      0 2842596  90200 1788956    0    0     0     8 1158 3072  1  1 98  0  0


pidstat shows context switch cost at process and core level, lets run some experiment to measure cost of context switch.

ContextSwitchApp program has context switch issues,execute this program and see some context switch numbers. This program runs 4 thread to do some processing.


Output of - pidstat -w -I -t -p 7729 5

pidstat output


Highlighted part contains context switch details over 5 second for 4 threads.

Highlighted part contains context switch(i.e output of vmstat) across cores.

Modern processor can execute billions of instruction but context switch can take away all these power.
Per context switch application looses around 80K instruction.

Lets do simple math to figure out how much instruction is lost due to Context Switch.


So CPU is executing 23% less instruction due to context switch. This is very good indication that context switches are bad for application performance.This context switch is due to contention between threads, reducing number of thread will improve the performance.

More detail profiling is required to identify the contention point, Solaris Studio is best opensource tool to do such profiling.

Monitor Memory - Swap in/out

Memory is next thing to monitor, application will run slow if swapping activity is high, each OS has area called Swap Space, this space is allocated on disk.
Swap Space is used when physical memory is exhausted by application, the OS will swap part of the application, this also puts additional load in GC algorithm.

  vmstat is the tool to get all the details of memory.

procs -----------memory---------- ---swap-- -----io---- -system-- ------cpu-----
 r  b   swpd   free   buff  cache   si   so    bi    bo   in   cs us sy id wa st
 1  0 830976 3207508  31392 993460    0    0     0    50 1111 3705  3  1 97  0  0
 1  0 830976 3234744  31408 993272    5    0     5   180 1127 3713  3  1 96  0  0
 5  0 830976 3230156  31416 996480    3    0    19    62 1209 4281  4  1 95  0  0
 2  0 830720 3229304  31424 996484    2    0     2    27 1196 4509  3  1 96  0  0
 1  0 830720 3229304  31432 996452    2    0     2     2 1237 4693  4  1 95  0  0

 0  0 830720 3228296  31440 996504    0    0     0    14 1538 4807  4  1 95  0  0

Memory
swpd: the amount of virtual memory used.
free: the amount of idle memory.
buff: the amount of memory used as buffers.
cache: the amount of memory used as cache.

Swap
si: Amount of memory swapped in from disk (/s).
so: Amount of memory swapped to disk (/s).

Lets look at sample vmstat output when this is happening.


Swapping start when free memory comes down to 141 MB, look at si and so column.
OS is put under load by application, it is under memory pressure, as physical memory is exhausted OS starts Swap Out.


Let look at graph to get better understanding.


As system is under memory constraint swapping in/out starts and then it returns back to normal when application end. This becomes worse when GC comes in action because it has to do swapping for GC cycles.


Run multiple instance of SwapApplication to see some numbers.

IO Activity


IO is one of the major bottleneck of many application, understanding what type of load application puts helps in building application that does not work against Disk.

You get complain that system is running slow and you suspect that disk could be the reason, now how to confirm that. How to check disk utilization ?

atop is wonderful tool for this, run atop -d to check disk utilization. You need admin privilege to run this.

On healthy system out of atop will be


Atop output - when disk utilization is high.


Run Diskusage program to generate disk load.

I went through just few tools but unix has tons of tools to figure out what application is doing and lot can be figured without looking at code.

All the code used in this post is available at osmonitor github repo.