Showing posts with label Apache Spark. Show all posts

Friday, 17 April 2020

Long Live ETL

Extract transform load is process for pulling data from one datasystem and loading into another datasystem. Datasystem involved are called source system and target system.

Shape of data from source system does not match to the target system, so some conversion is required to make it compatible and that process is called transformation. Transformation is made of map/filter/reduce operations.


To handle the incompatibility between data systems some metadata is required. What type of metadata will be useful ?
It is very common that source data will be transformed to many different shape to handle various business usecase, so it makes sense to use descriptive metadata for source system and prescriptive metadata for target system.

Metadata plays important role in making system both backward and forward compatible.
 
Many times just having metadata is not enough because some source/target system data is too large or too small to fit.


This is situation when transformation becomes interesting. This means some value have to dropped or set to NULL or to default value, making good decision about this is very important for backward/forward compatibility of transformation. I would say many business success also depends on how this problem is solved! Many integration nightmare can be avoided if this is done properly.

So far we were discussing about single source system but for many use case data from other systems is required to do some transformation like converting userid to name , deriving new column value , lookup encoding and many more.

Adding multiple source system adds complexity in transformation to handle missing data , stale data and many more.

As datasystems are evolving so it is not only about relation store today we see key-value store , document store , graph db , column store , cache , logs etc.

New datasystems are distributed also, so this adds another dimension to complexity of transformation.

Our old relational databases can be also described as it is built using ETL pattern by using change log as source for everything database does

One of the myth about ETL is that it is batch process but that is changing overtime with Stream processor (i.e Spark Streaming , Flink etc) and Pub Sub systems ( Kafka , Pulsur etc). This  enables to do transformation immediately after event is pushed to source system.

Don't get too much carried away by Streaming buzzword, no matter which stream processor or pub sub system you use but you still have to handle above stated challenges or leverage on some of new platform to take care of that.

Invest in transformation/business logic because it is key to building successful system that can be maintained and scaled. 
Keeping it stateless, metadata driven, handle duplicate/retry etc, more importantly write Tests to take good care of it in fast changing time.

Next time when you get below question on your ETL process 
Do you process real time or batch ? 

You answer should be 
It is event based processing.


Long live E T L

Sunday, 10 February 2019

Adaptive scheduling of Spark Job using YARN API

In last blog poorman spark monitoring i shared approach on how to figure out how long Spark Job is waiting for resource.

This post covers some more details on how to be proactive when Spark Job is stuck due to resource constraint.

Little recap of Yarn.
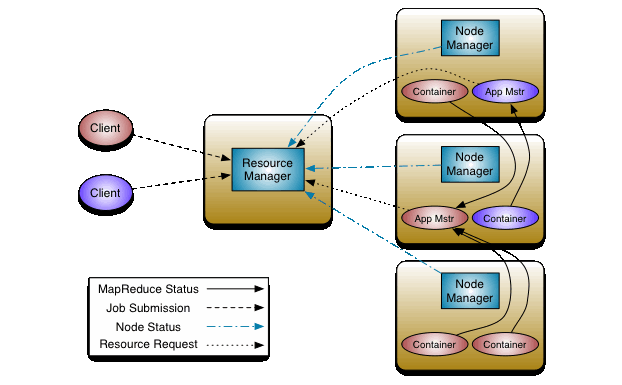
Apache Yarn is resource management and job scheduling framework for hadoop distributed processing framework.

MapReduce NextGen Architecture

Hadoop cluster are shared between teams and for proper utilization of cluster teams/projects are allocated some capacity of cluster.

One of the popular scheduling approach is "Capacity Scheduler" for multi tenant cluster and it is based on Queues.
Yarn allows to define min & max resource for Queue and it is hierarchical, it looks something like below

Capacity Scheduler


One of the issues that can happen in Capacity Scheduler is that your job is submitted to overloaded queue and it gets stuck in Accepted state for long time although other queues has some capacity which is just left unused.
Another common issue is Job started running but did not got all the resource(cores/memory) and will run forever because queue is overloaded.

Yarn gives REST API to query state of cluster/queues/application and that can be used to solve issues where resource is available in cluster but application is not using it :-)

Yarn API to build adaptive job submission
Yarn API comes very handy in solving both of the above issue, some of the strategy using yarn API.

 - Submit job to queue that has capacity.
This type of strategy will select queue at run-time and submit application to least loaded queue.

 - Move Job to queue that has capacity.
This type of strategy will monitor job status and if it is not moving or get stuck in "Accepted" state then will move it to queue that has some capacity.

Abstraction of Yarn API to get minimum details that will allow adaptive job submission.

Once we get all the metrics required for making decision then it becomes straight forward to submit/move the job.
Below code snippet try to move the job based on simple strategy of max wait time for Accepted status App.

Yarn exposes lots of metrics that can used to building adaptive system. You can refer to ResourceManagerRest for full set of API.

Word of caution that be fair when you are using this strategy, don't use whole cluster alone.
Image result for greedy


Code used in post is available @ yarn github project

Saturday, 26 January 2019

Poorman Spark monitoring

Spark exposes lots of metrics to get insights on what is happening inside Spark Application but some time you are looking for quick metrics on spark application.

In this post i will share example of some metrics that can be collected quickly using simple pattern.

How long my spark application is waiting for resource allocation ?
I always felt need of this metrics when running in shared cluster with limited capacity allocated to user.
This metrics is useful to know when spark job is stuck because cluster is busy.

Pattern is very simple start timer thread that monitor spark context creation and logs time at regular interval.

Code snippet for monitor code

Just start timer before SparkContext is created using below code

 monitoringExecutor.submit(newCallable(checkSparkContext))

How many records spark job/stage is processing ?

This is based on pattern that we need distributed counter to track how many records are processed by stage.
Spark has something called LongAccumulator that an be used for capturing metrics like this.

So we need block of code that is just logs value of accumulator and takes some action if it is not moving fast.
Code snippet for tracking records processed.

monitorRecordsProcessed is submitted for async execution and processData in map function will increment counter.

Note about accumulator that these are shared variables between driver & executors. If accumulator are written on executor side then there is chance of multiple/double writes due to retry of failed stages.
So just take that in account when dealing with Accumulator , they are very good as debugging tool or giving interactive feedback of processing but it can contain some noise when jobs/stages are failing.

Spark is using Accumulator to tracking stage internal metrics and all that is available on Spark UI.

How do we get access spark internal metrics ?

Now we are getting in Rich man monitoring. Lets look at example that gives access to internal accumulators and also exposes API to get all the metrics during job execution.

Below code logs all the accumulators at stage level, only rule is give name to accumulator so that it is available as internal spark metrics.

Once listener is defined then just add it to sparkContext

sparkSession.sparkContext.addSparkListener(new StageAccumulatorListener)

This listener will start showing all the accumulators, sample of logs

Record counter also come in this list because it was named value.

Spark gives API to get access to metrics during execution and it can be used to build proactive monitoring system.

All the code used in this post is available on poormonitor github


Sunday, 30 September 2018

Anatomy of Apache Spark Job

Apache Spark is general purpose large scale data processing framework. Understanding how spark executes jobs is very important for getting most of it.

Little recap of Spark evaluation paradigm

Spark is using lazy evaluation paradigm in which Spark application does not anything till driver calls "Action".

Lazy eval is key to all the runtime/compile time optimization spark can do with it.
Lazy eval is not new concept it is used in functional programming for decades, data base also uses this for creating logical & physical execution plan.

 Neural network framework like tensorflow is also based on lazy eval, first it builds compute graph and then execute its.


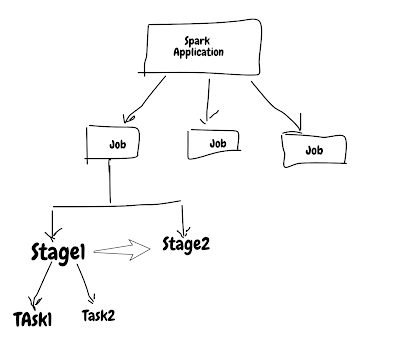
Spark application is made up of jobs , stages & tasks. Jobs & task are executed in parallel by spark but stage inside job are sequential.
Knowing what executes parallel and sequence is very important when you want to tune spark jobs.

Stage are executed in order, so job with many stage will choke on it and also previous stage will feed next stage and it comes with some overhead that involves writing stage output to persistent source(i.e disk, hdfs, s3 etc) and reading it again. This is also called wide transformation/Shuffle dependency.

Job with single stage will be very fast but you can't build any useful application using single stage.

Examples
Lets see some code examples to understand this better.


Spark DAG


This DAG view from spark ui makes it very clear that how Spark sees/execute application.
Above code is creating 3 stage and every stage boundary has some overhead like (Shuffle read/write).
Steps in single stage for eg stage 1 has filter & map merged.

This view also has "Tasks", that is the smallest unit of work that is executed. This application has 2 task per stage.


How spark application is executed
Lets deep dive into how it is executed. Spark application needs 3 component to execute

  • Driver - This submit request to master and coordinate all the tasks. 
  • Cluster Manager - Launches spark executor based on request from driver.
  • Executor  - Executes job and send result back to driver.


2 important component involved in spark application is Driver & Executor, spark job can fail when any of these component are under stress it could be memory/CPU/network/disk.

In next section i will share some of my experience with issues on executor side.
Executor Issues
Each executor needs 2 parameter Cores & Memory.
Cores decided how many task that executor can process and memory is shared between all the cores/task in that executors.

Each spark job has different type of requirement ,so it is anti-pattern to use single config for all the Spark applications.

Issue 1 - Too big task for executor
Executor will fail to process the task or run slow if task is too big to fit in memory.
Few things to look for when this is the issue
  •   Long pause on driver log file( i.e log file not moving)
  •  GC time is too long, it can be verified from "executors" page on spark UI


  • Retry of Stage


  • Executor Log full of "spilling in-memory map" message
2018-09-30 03:30:06 INFO  ExternalSorter:54 - Thread 44 spilling in-memory map of 371.0 MB to disk (6 times so far)
2018-09-30 03:30:24 INFO  ExternalSorter:54 - Thread 44 spilling in-memory map of 379.5 MB to disk (7 times so far)
2018-09-30 03:30:38 INFO  ExternalSorter:54 - Thread 44 spilling in-memory map of 373.8 MB to disk (8 times so far)
2018-09-30 03:30:58 INFO  ExternalSorter:54 - Thread 44 spilling in-memory map of 384.0 MB to disk (9 times so far)
2018-09-30 03:31:17 INFO  ExternalSorter:54 - Thread 44 spilling in-memory map of 382.7 MB to disk (10 times so far)
2018-09-30 03:31:38 INFO  ExternalSorter:54 - Thread 44 spilling in-memory map of 371.0 MB to disk (11 times so far)
2018-09-30 03:31:58 INFO  ExternalSorter:54 - Thread 44 spilling in-memory map of 371.0 MB to disk (12 times so far)

  • Executor log with OOM error
2018-09-30 03:34:35 ERROR Executor:91 - Exception in task 0.0 in stage 3.0 (TID 273)
java.lang.OutOfMemoryError: GC overhead limit exceeded
 at java.util.Arrays.copyOfRange(Arrays.java:3664)
 at java.lang.String.<init>(String.java:207)
 at java.lang.StringBuilder.toString(StringBuilder.java:407)
 at sun.reflect.MethodAccessorGenerator.generateName(MethodAccessorGenerator.java:770)
 at sun.reflect.MethodAccessorGenerator.generate(MethodAccessorGenerator.java:286)
 at sun.reflect.MethodAccessorGenerator.generateSerializationConstructor(MethodAccessorGenerator.java:112)


How to solve this ?

One option that comes quickly is to increase memory on executor side and it works but there will be limit on how much memory you can add to executor side, so very soon you will run out of this option because most of the cluster are shared and it has limit on max memory that can be allocated to executor. 

Next better option is to make individual task small and it is all in your control. This has tradeoff of more shuffle but it is still better than previous one.

Spark UI snapshot for bad run & good run.

Bad Run

Good Run

Second one is with adjusting partition size. Bad run has all the indicator that it needs tuning on partition size.

Issue 2 - Too many cores in executor

This is also also very common problem because we want to overload executor by throwing too many task.
Lets see how to spot if this is issue

  • Time spent on GC on executor side
  • Executor log with message - spilling in-memory map
  • Peak Execution Memory on executor during task execution. This is only available when job is running not on history server.

I will put 2 snapshot from sparkUI

PartitionExecutorCoresMemory
Run 1100242g
Run 1100222g

4 Cores/2 Executor

2 Cores/2 Executor
8 Cores(4*2 Exe) one is busy with GC overhead, with 4 cores(2 * 2 Executor) everything cuts down by half, it is more efficient by using just 4 cores.

If you see pattern like these then reduce executor core and increase no of executors to make spark job faster.

Issue 3 - Yarn memory overhead

This is my favorite and below error confirms that Spark application is having this issue
"ExecutorLostFailure (executor 2 exited caused by one of the running tasks) Reason: Container killed by YARN for exceeding memory limits. 
XXX GB of XXX GB physical memory used. Consider boosting spark.yarn.executor.memoryOverhead"

When ever this error comes most of the developer goes on stack overflow and increase "spark.yarn.executor.memoryOverhead" parameter value.
This is ok option for short term will fail again soon and you will keep on increasing it and finally run out of option.

I think increasing "spark.yarn.executor.memoryOverhead" as anti pattern because whatever memory is specified is added to total memory of executors..
This error means executor is overloaded and best option is try other solution that i mention above.

Spark has so many tuning parameter that some time it looks like siting in plan cockpit.

All the code used in this blog is available @ sparkperformance github repo

Saturday, 26 May 2018

Custom Logs in Apache Spark

Have you ever felt the frustration of Spark job that runs for hours and it fails due to infra issue.
You know about this failure very late and waste couple of hours on it and it hurts more when Spark UI logs are also not available for postmortem.

You are not alone!

In this post i will go over how to enable your own custom logger that works well with Spark logger.
This custom logger will collect what ever information is required to go from reactive to proactive monitoring.
No need to setup extra logging infra for this.

Spark 2.X is based using Slf4j abstraction and it is using logback binding.

Lets start with logging basic, how to get logger instance in Spark jobs or application.

val _LOG = LoggerFactory.getLogger(this.getClass.getName)

It is that simple and now your application is using same log lib and settings that Spark is based on.

Now to do something more meaningful we have to inject our custom logger that will collect info and write it to Elastic search or Post to some REST endpoint or sends alerts.

lets go step by step to do this

Build custom log appender
Since spark 2.X is based on logback, so we have to write logback logger.

Code snippet for custom logback logger

This is very simple logger which is counting message per thread and all you have to do it override append function.

Such type of logger can do anything like writing to database or sending to REST endpoint or alerting .

Enable logger
For using new logger, create logback.xml file and add entry for new logger.
This file can be packed in Shaded jar or can be specified as runtime parameter.

Sample logback.xml
This config file adding MetricsLogbackAppender as METRICS
<appender name="METRICS" class="micro.logback.MetricsLogbackAppender"/>

Next enabling it for package/classes that should use this
<logger level="info" name="micro" additivity="true">    <appender-ref ref="METRICS" /></logger>
<logger level="info" name="org.apache.spark.scheduler.DAGScheduler" additivity="true">    <appender-ref ref="METRICS" /></logger>

You are done!

Any message logged from 'micro' package or from DAGScheduler class will be using new logger .
Using this technique executor logs can be also capture and this becomes very useful when spark job is running on hundred or thousands of executor.

Now it opens up lots of option of having BI that shows all these message at real time, allow team to ask interesting questions or subscribe to alters when things are not going well.

Caution : Make sure that this new logger is slowing down application execution, making it asynchronous is recommended.

Get the insight at right time and turn it to action

Code used in this blog is available @ sparkmicroservices repo in github.

I am interested in knowing what logging patterns you are using for Spark.