Introduction
In-Memory computing is picking up due to affordable hardware, most of the data is kept in RAM to meet latency and throughput goal, but keeping data in RAM create Garbage Collector overhead especially if you don't pre allocate.
So effectively we need garbage less/free approach to avoid GC hiccups
Garbage free/less data structure
There are couple of option to achieve it
- Object Pool
Object pool pattern is very good solution, i wrote about that in Lock Less Object Pool blog
- Off Heap Objects
JVM has very good support for creating off-heap objects. You can get rid of GC pause if you take this highway and highway has its own risk!
-MemoryMapped File
This is mix of Heap & Off Heap, like best of world.
Memory mapped file will allow to map part of the data in memory and that memory will be managed by OS, so it will create very less memory overhead in JVM process that is mapping file.
This can help in managing data in garbage free way and you can have JVM managing large data.
Memory Mapped file can be used to develop IPC, i wrote about that in power-of-java-memorymapped-file blog
In this blog i will create ArrayList that is backed up by MemoryMapped File, this array list can store millions of object and with almost no GC overhead. It sounds crazy but it is possible.
Lets gets in action
In this test i use Instrument object that has below attribute
- int id
- double price
So each object is of 12 byte.
This new Array List holds 10 Million Object and i will try to measure writer/read performance
Writer Performance

X Axis - No Of Reading
Y Axis - Time taken to add 10 Million in Ms
Adding 10 Million element is taking around 70 Ms, it is pretty fast.

X Axis - No Of Reading
Y Axis - Throughput /Second , in Millions
Writer throughput is very impressive, i ranges between 138 Million to 142 Million
Reader Performance

X Axis - No Of Reading
Y Axis - Time taken to read 10 Million in Ms
It is taking around 44 Ms to read 10 Million entry, very fast. With such type of performance you definitely challenge database.
Reader Throughput

X Axis - No Of Reading
Y Axis - Throughput /Second , in Millions
Wow Throughput is great it is 220+ million per second
It looks very promising with 138 Million/Sec writer throughput & 220 Million/Sec reader throughput.
Comparison With Array List
Lets compare performance of BigArrayList with ArrayList,
Writer Throughput - BigArrayList Vs ArrayList

Throughput of BigArrayList is almost constant at around 138 Million/Sec, ArrayList starts with 50 Million and drops under 5 million.
ArrayList has lot of hiccups and it is due to
- Array Allocation
- Array Copy
- Garbage Collection overhead
BigArrayList is winner in this case, it is 7X times faster than arraylist.
Reader Throughput - BigArrayList Vs ArrayList
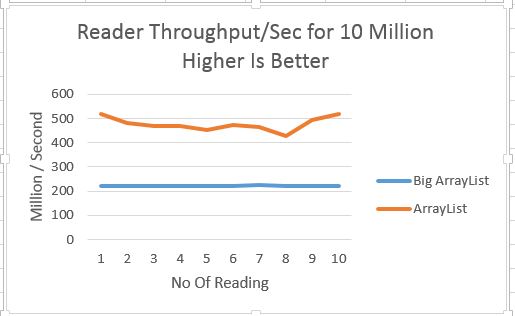
ArrayList performs better than BigArrayList, it is around 1X time faster.
BigArrayList is slower in this case because
- It has to keep mapping file in memory as more data is requested
- There is cost of un-marshaling
Reader Throughput for BigArrayList is 220+ Million/Sec, it is still very fast and only few application want to process message faster than that.
So for most of the use-case this should work.
Reader performance can be improved by using below techniques
- Read message in batch from mapped stream
- Pre-fetch message by using Index, like what CPU does
By doing above changes we can improve performance by few million, but i think for most of the case current performance is pretty good
Conclusion
Memory mapped file is interesting area to do research, it can solve many performance problem.
Java is now being used for developing trading application and GC is one question that you have to answer from day one, you need to find a way to keep GC happy and MemoryMapped is one thing that GC will love it.
Code used for this blog is available @ GitHub , i ran test with 2gb memory.
Code does't handle some edge case , but good enough to prove the point that that MemoryMapped file can be winner in many case.
In-Memory computing is picking up due to affordable hardware, most of the data is kept in RAM to meet latency and throughput goal, but keeping data in RAM create Garbage Collector overhead especially if you don't pre allocate.
So effectively we need garbage less/free approach to avoid GC hiccups
Garbage free/less data structure
There are couple of option to achieve it
- Object Pool
Object pool pattern is very good solution, i wrote about that in Lock Less Object Pool blog
- Off Heap Objects
JVM has very good support for creating off-heap objects. You can get rid of GC pause if you take this highway and highway has its own risk!
-MemoryMapped File
This is mix of Heap & Off Heap, like best of world.
Memory mapped file will allow to map part of the data in memory and that memory will be managed by OS, so it will create very less memory overhead in JVM process that is mapping file.
This can help in managing data in garbage free way and you can have JVM managing large data.
Memory Mapped file can be used to develop IPC, i wrote about that in power-of-java-memorymapped-file blog
In this blog i will create ArrayList that is backed up by MemoryMapped File, this array list can store millions of object and with almost no GC overhead. It sounds crazy but it is possible.
Lets gets in action
In this test i use Instrument object that has below attribute
- int id
- double price
So each object is of 12 byte.
This new Array List holds 10 Million Object and i will try to measure writer/read performance
Writer Performance

X Axis - No Of Reading
Y Axis - Time taken to add 10 Million in Ms
Adding 10 Million element is taking around 70 Ms, it is pretty fast.
Writer Throughput
Lets look at another aspect of performance which is throughput
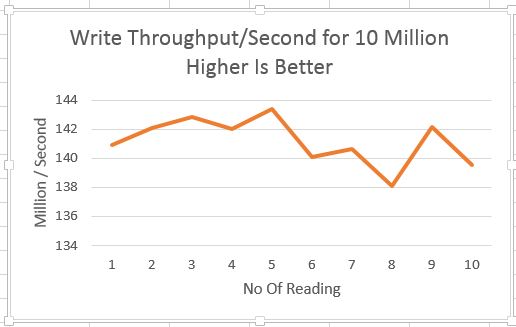
X Axis - No Of Reading
Y Axis - Throughput /Second , in Millions
Writer throughput is very impressive, i ranges between 138 Million to 142 Million
Reader Performance

X Axis - No Of Reading
Y Axis - Time taken to read 10 Million in Ms
It is taking around 44 Ms to read 10 Million entry, very fast. With such type of performance you definitely challenge database.
Reader Throughput

X Axis - No Of Reading
Y Axis - Throughput /Second , in Millions
Wow Throughput is great it is 220+ million per second
It looks very promising with 138 Million/Sec writer throughput & 220 Million/Sec reader throughput.
Comparison With Array List
Lets compare performance of BigArrayList with ArrayList,
Writer Throughput - BigArrayList Vs ArrayList

Throughput of BigArrayList is almost constant at around 138 Million/Sec, ArrayList starts with 50 Million and drops under 5 million.
ArrayList has lot of hiccups and it is due to
- Array Allocation
- Array Copy
- Garbage Collection overhead
BigArrayList is winner in this case, it is 7X times faster than arraylist.
Reader Throughput - BigArrayList Vs ArrayList

ArrayList performs better than BigArrayList, it is around 1X time faster.
BigArrayList is slower in this case because
- It has to keep mapping file in memory as more data is requested
- There is cost of un-marshaling
Reader Throughput for BigArrayList is 220+ Million/Sec, it is still very fast and only few application want to process message faster than that.
So for most of the use-case this should work.
Reader performance can be improved by using below techniques
- Read message in batch from mapped stream
- Pre-fetch message by using Index, like what CPU does
By doing above changes we can improve performance by few million, but i think for most of the case current performance is pretty good
Conclusion
Memory mapped file is interesting area to do research, it can solve many performance problem.
Java is now being used for developing trading application and GC is one question that you have to answer from day one, you need to find a way to keep GC happy and MemoryMapped is one thing that GC will love it.
Code used for this blog is available @ GitHub , i ran test with 2gb memory.
Code does't handle some edge case , but good enough to prove the point that that MemoryMapped file can be winner in many case.


