Thursday 22 November 2018

Spark Run local design pattern

Many spark application has now become legacy application and it becomes very hard to enhance, test & run locally.

Spark has very good testing support but still many spark application is not testable.
I will share one common error that you see when try to run some old spark application.


When you see such error you have 2 option
 - Forget it that it can't be run locally and continue work with this frustration.
 - Fix it to run locally and show example of The Boy Scout Rule to your team


I will show very simple pattern that will save from such frustration.

This code is using isLocalSpark function to decided how to handle local mode and you can use any technique to make that decision like have env parameter or command line parameter or any thing else.

Once you know it is run local then create spark context based on it.

Now this code can run locally or via Spark-Submit also.

Happy Spark Testing.
Image result for i love testing

Code used in this blog is available @ runlocal repo

Sunday 18 November 2018

Insights from Spark UI

As continuation of anatomy-of-apache-spark-job post i will share how you can use Spark UI for tuning job

I will continue with same example that was used in earlier post, new spark application will do below things

 - Read new york city parking ticket
 - Aggregation by "Plate ID" and calculate offence dates
 - Save result

DAG for this code looks like this


This is multi stage job, so some data shuffle is required, for this sample shuffle write is 564mb and output is 461 MB.

Lets see what we can do to reduce this ?
lets take top down approach from "Stage2". First thing that comes to mind is explore compression.

Current code

New Code


New code is only enabling gzip on write, lets see what we see on spark UI

Save with Gzip


With just write encoder write went down by 70%. Now it 135Mb and it speed up the job.

Lets see what else is possible before we dive in more internals tuning

Final output looks some like below

1RA32   1       05/07/2014
92062KA 2       07/29/2013,07/18/2013
GJJ1410 3       12/07/2016,03/04/2017,04/25/2015
FJZ3486 3       10/21/2013,01/25/2014
FDV7798 7       03/09/2014,01/14/2014,07/25/2014,11/21/2015,12/04/2015,01/16/2015

Offence date is stored in raw format, it is possible to apply little encoding on this to get some more speed.

Java 8 added LocalDate to make date manipulation easy and this class comes with some handy functions, one of that is toEpocDay.
This function convert date to day from 1970 and so it means that in 4 bytes(Int) we can store upto 5K years, this seems big saving as compared to current format which is taking 10 bytes.

Code snippet with epocDay

Spark UI after this change. I have also done one more change to use KryoSerializer


This is huge improvement , Shuffle write changed from 564Mb to 409MB ( 27% better) and output from 134Mb to 124 Mb( 8% better)

Now lets go to another section on Spark UI that shows logs from executor side.
GC logs for above run shows below thing

2018-10-28T17:13:35.332+0800: 130.281: [GC (Allocation Failure) [PSYoungGen: 306176K->20608K(327168K)] 456383K->170815K(992768K), 0.0222440 secs] [Times: user=0.09 sys=0.00, real=0.03 secs]
2018-10-28T17:13:35.941+0800: 130.889: [GC (Allocation Failure) [PSYoungGen: 326784K->19408K(327168K)] 476991K->186180K(992768K), 0.0152300 secs] [Times: user=0.09 sys=0.00, real=0.02 secs]
2018-10-28T17:13:36.367+0800: 131.315: [GC (GCLocker Initiated GC) [PSYoungGen: 324560K->18592K(324096K)] 491332K->199904K(989696K), 0.0130390 secs] [Times: user=0.11 sys=0.00, real=0.01 secs]
2018-10-28T17:13:36.771+0800: 131.720: [GC (GCLocker Initiated GC) [PSYoungGen: 323744K->18304K(326656K)] 505058K->215325K(992256K), 0.0152620 secs] [Times: user=0.09 sys=0.00, real=0.02 secs]
2018-10-28T17:13:37.201+0800: 132.149: [GC (Allocation Failure) [PSYoungGen: 323456K->20864K(326656K)] 520481K->233017K(992256K), 0.0199460 secs] [Times: user=0.12 sys=0.00, real=0.02 secs]
2018-10-28T17:13:37.672+0800: 132.620: [GC (Allocation Failure) [PSYoungGen: 326016K->18864K(327168K)] 538169K->245181K(992768K), 0.0237590 secs] [Times: user=0.17 sys=0.00, real=0.03 secs]
2018-10-28T17:13:38.057+0800: 133.005: [GC (GCLocker Initiated GC) [PSYoungGen: 324016K->17728K(327168K)] 550336K->259147K(992768K), 0.0153710 secs] [Times: user=0.09 sys=0.00, real=0.01 secs]
2018-10-28T17:13:38.478+0800: 133.426: [GC (Allocation Failure) [PSYoungGen: 322880K->18656K(326144K)] 564301K->277690K(991744K), 0.0156780 secs] [Times: user=0.00 sys=0.00, real=0.01 secs]
2018-10-28T17:13:38.951+0800: 133.899: [GC (Allocation Failure) [PSYoungGen: 323808K->21472K(326656K)] 582842K->294338K(992256K), 0.0157690 secs] [Times: user=0.09 sys=0.00, real=0.02 secs]
2018-10-28T17:13:39.384+0800: 134.332: [GC (Allocation Failure) [PSYoungGen: 326624K->18912K(317440K)] 599490K->305610K(983040K), 0.0126610 secs] [Times: user=0.11 sys=0.00, real=0.02 secs]
2018-10-28T17:13:39.993+0800: 134.941: [GC (Allocation Failure) [PSYoungGen: 313824K->17664K(322048K)] 600522K->320486K(987648K), 0.0111380 secs] [Times: user=0.00 sys=0.00, real=0.02 secs]

Lets focus on one the line

2018-10-28T17:13:39.993+0800: 134.941: [GC (Allocation Failure) [PSYoungGen: 313824K->17664K(322048K)] 600522K->320486K(987648K), 0.0111380 secs] [Times: user=0.00 sys=0.00, real=0.02 secs]

Heap before minor GC was 600MB and after that 320MB and total heap size is 987 MB.
Executor is allocated 2gb and this Spark application is not using all the memory, we can put more load on executor by send more task or bigger task.

I will reduce input partition from 270 to 100


With 270 input partition 


With 100 input partition


100 input partition looks better with around 10+% less data to shuffle.

Other tricks
Now i will share some of things that will make big difference in GC!

Code before optimization

Code after optimization

New code is doing optimized merge of set, it is adding small set to the big one and also introduced Case class.
Another optimization is in save function where it is using mapPartitions to reduce object allocation by using StringBuffer.

I used http://gceasy.io to get some GC stats.

Before code change


After code change

New code is producing less garbage for eg. 
 Total GC 126 gb vs 122 gb ( around 4% better)
 Max GC time 720ms vs 520 ms ( around 25% better)

Optimization looks promising.

All the code used in this blog is available on github repo sparkperformance

Stay tuned up for more on this.

Saturday 10 November 2018

SQL is Stream


Stream API for any language looks like writing SQL.

Map is Select Columns
filter is Where
count is Count(1)
limit is LIMIT X
collect is get all result on client side

So it is very easy to map all the functions of Streams API to some part of SQL.

Object relation mapping framework like (hibernate, mybatis, JPA, Toplink,ActiveRecord etc) give good abstraction over SQL but adds lot of overhead and also does not give much control on how SQL is build and many times you have write native SQL.

Image result for i hate hibernate

ORM never made writing SQL easy and if you don't trust me then quick refresh to how code looks .

Sometime i feel that engineer are writing more annotation than real algorithm!

To implement any feature we have to keep switching between SQL API and non sql API, this makes code hard to maintain and many times it is not optimal also.

This problem can be solved by having library that is based on Streams API and it can generate SQL then we don't have to switch, it becomes unified programming experience.

With such library testing will become easy as source of stream can be changed on need basis like in real env it is database and it test it is in memory data structure.

In this post i will share toy example of how library will look look like.

Code Snippet

Stream<StocksPrice> rows = stocksTable.stream();
long count = rows
                .filter(Where.GT("volume", 1467200))
                .filter(Where.GT("open_price", 1108d))
                .count();

Above code generates
Select Count(1) From stocks_price where volume > 1467200 AND open_price > 1108

Look at another example with Limit

stocksTable.stream()
                .filter(Where.GT("volume", 1467200))
                .filter(Where.GT("open_price", 1108d))
                .limit(2)
                .collect(Collectors.toList());

Select stock_symbol,open_price,high_price,trade_date FROM stocks_price WHERE volume > 1467200 AND open_price > 1108.0 LIMIT 2

These API can also use code generation to give compile time safety like checking column names, type etc.

Benefits 

Streams API comes will give some other benefits like
 - Parallel Execution
 - Join between database data and non db data can be easily done using map.
- Allows to use pure streaming approach and this is good when dealing with huge data.
- Opens up options of generating Native optimized query because multiple phase of pipeline can be merged.

This programming model is not new , it is very common in distributed computing framework like Spark, Kafka, Flink etc.

Spark dataset is based on this approach where it generates optimized query like pushing filters to storage, reducing reads by looking at partitions, selective column read etc.

Conclusion

Database driver must give stream based API and this will help in reducing dependency on ORM framework.
This is very powerful programming model and opens up lots of options.

Code used in this post is available @ streams github repo.

Friday 26 October 2018

Broken promise of Agile

AgileManifesto was written 17 years back(i.e 2001) and is it able to bring the change to industry ?


I would say yes but not is the way authors wanted.

Many consulting company made millions of $ but as software engineer i did not see the change.

How did Agile broke promise

I will put key things that authors wanted so we have some context to discuss about this

Individuals and interactions over processes and tools
Working software over comprehensive documentation

Customer collaboration over contract negotiation

Responding to change over following a plan


This looks so good :-)

Lets start with education industry

"Attend Agile training for 2 days and you are certified Scrum master or Agile Developer"

What did people learn after these workshop ? Standup, Planning Poker, retrospective , backlog grooming , JIRA and many more things.

One thing that is missing is "Agile mindset" , no one can teach or learn this in 2 days so it is big joke that you team went to expensive training and they are Agile Team.

Lets go over main items so see how industry see main goals of Agile

  • Individuals and interactions over processes and tools
Almost all the team got this wrong, they thought we need more tools JIRA was born, industry created big ceremony(backklog groming, standup, reto etc)
I think have too many things in JIRA tell only one thing that software quality is bad or team is too slow to delivery features or product team is creating shopping list of features that they never wanted.

Now it has gone to extend that you need multiple product owner for just grooming session and scrum masters for running retrospective meeting and to add more project manager to track story points/burn down etc.

Team is spending more time on Jira board rather than talking to team. We killed individual& interactions .

How many tools or process we added ? it is count less .

  • Working software over comprehensive documentation
People got confused with this and they said i need working software + document. Now nothing got done properly and some team will come and say we are AgileWater it mean we build software fast but also use documents that is required for waterfall.
Developer endup doing more non productive work.

Working Software was also take as team is allowed to release crap in production because we are Agile.
What was meant by working software was MVP not 20% or 40% developed item, feature is done or not done there is nothing like 50% when that feature is released to production.

Team is put in so much pressure to release that they end up taking shortcut and to address that "Tech Debt" drive is required.

When software team goes to product to get fund/approval to fix all the Tech Debt then team comes and say why did you develop & deploy crap piece of software.
  • Customer collaboration over contract negotiation
This is classic customer used Agile for blackmailing or question team credential to put last minute change. This gives them licences to change the requirement any time.
Not to miss commitment that is taken inform of Story Points and if team miss that then it is expected that they need to put extra hours.

Dev team is not different they use this as excuse to build  bad quality of software.

  • Responding to change over following a plan
Agile never said that build feature without tests, architecture or no plan.
Planning is must and good architecture also but it should be Just enough to move in right direction and it is continuous architecture without end state.

Team took this like no design or architecture to response to change.

Conclusion

One of my favorite questions about sprint is

"How long is your sprint ?"
 2/3 weeks ?

"Why 2 weeks , why not 1 month or 1 year ? who decided this ?"
It is written in Agile manifesto or my manager told this or i don't know other teams are doing this .

"How long ticket sits in backlog before making to production ?"
I don't know . Check with my TPM or if some one knows they will come and tell 1 year or 3 year"


Agile was about giving team freedom to choose sprint size based on when they are ready for feedback or customer is ready to give feedback
Sprint can 1 week or 6 months but key point is you should get the feedback after that and adjust.
If customer are not in the feedback loop then go back to waterfall .

Another thing was about Software Craftmanship.
Agile project has so many non developer like Project manager, Project manager, Scrum Master, Agile coach that they don't value Craftmanship , so we developer start new conference on this and get more disconnected.

Agile was written by developer for developer but now we are out and this place is taking by non-developers .

In Agile Conference ask the question "how many developer? "
You will see less hands :-( because they are in other craftman conference.

Agile project are about project management, dates, money , time.
Manager makes sure that plan is made by them and followed by team.

Today all project are agile but they still fail, over budget, never on time.

Any process like Agile has one hidden feedback that is called "Dissatisfaction" and you need respond to that change to become better.

Our Software industry has three inevitable things
 - Degradation
 - Dysfunction
 - Expiry

Degradation ->  Maintaining,Transformation
Dysfunction -> Innovation & Challenge
Expiry  -> Creating & Starting over

Degradation ,Dysfunction & Expiry applies to people, project, team,process , strategy , organization.

Agile is no different identify the phase and create version 2 of process or find new one that works.


Tuesday 23 October 2018

Simple Testing Can Prevent Most Critical Failures

Error handling is one of the hardest and ignored part of software development and if system is distributed then this becomes even harder.

Nice paper is written on Simple Testing Can Prevent Most Critical Failures topic.
Every developer should read this paper. I will try to summarized key take away from this paper but will suggest to read the paper to get more details about it.

Image result for testing in production


Distributed system outage is common and some of the recent example are 

Youtube was down on Oct,2018 for around 1+ hour
Amazon was down during Prime day on July,2018
Google services like Map,Gmail,Youtube were down numerous time in 2018
Facebook was also down apart from many data leak issues they are facing.


This paper talks about catastrophic failure that happened in distributed system like Cassandra, Hbase , HDFS, Redis, Map Reduce.

As per paper most of the errors are due to 2 reason

 - Failure happens due to complex sequence of events
 - Catastrophic error are due to incorrect handling
 - I will include 3rd one on "ignoring of design pressure" which i wrote in design-pressure-on-engineering-team post

Example from HBase outage

1 - Load balancer Transfer region R from Slave A to Slave
2 - Slave B open region R
3 - Master delete current Zookeeper region R after it is owned by Slave B
4 - Slave B dies
5 - Region R is assigned to Slave C & Slave C open the region
6 - Master tries to delete Slave B znode on Zookeeper and because Slave b is down and whole cluster goes down due to wrong error handling code.

In above example sequence of event matters to reproduce issue.

HDFS failure when block is not replicated.


In this example also sequence of event and when new data node starts it exposes bug of system.

Paper has many more examples.

Root cause of error 

92% of the catastrophic error happens due to incorrect error handling.
What this means is that error was deducted but error handling code was not good, does this sound like lots of project you have worked on !

1 - Error are ignored
This is reason of 25% of the failure, i think number will be high in many live system.

eg of such error
catch(RebootException e) {
   log.info("Reboot occurred....")
}

Yes this harmless looking log statement is ignoring exception and is very common anti pattern of error handling.

2 - Overcatch exception
This is also very common like having generic catch block and bringing down the whole system

catch(Throwable e) {
     cluster.abort()
}

3 - TODO/FIXME in comments
Yes real distributed system in production also has lots of TODO/FIXME in critical section of code.

Some other example of error handling

} catch (IOException e) {
 // will never happen
 }

} catch (NoTransitionException e) {
 /* Why this can happen? Ask God not me. */
 }


try { tableLock.release(); }
catch (IOException e) {
 LOG("Can't release lock”, e);


4 - Feature development is prioritized
 I think all the software engineers will agree to it. This is also called Tech Debt and i can't think of better example than Knight Capital bankruptcy which was due to config & experimental code.

Conclusion

All the errors are complex to reproduce but better unit test will definitely catch these, this also shows that unit/integration test done in many system is not testing scenario like service going down and coming back again and how it impacts system.

Based on above example it will look like all error are due to java checked exception but it is not different in other system like C/C++ which does not have checked but everything is unchecked , it is developer responsibility to check for it at various places.

On side note language with no type system like Python makes it very easy to write code that will break at runtime and if you are really unlucky then error handling code will have some type error and it will get tested in production.

Also almost all product will have some static code tool(findbugs) integration but these tools does not give more importance to such error handling anti pattern.


Link to issues mention in paper
HDFS
MapReduce
HBase
Redis
Cassandra

Please share about more anti pattern you have seen in production system.
Till then Happy unit testing.


Friday 19 October 2018

When microservices becomes darkservices

Micro services is great and many company comes and talk about it on how it is used for scaling team, product etc

Microservices has dark side also and as a programmer you should about it before going on ride.
In this post i will share some of the myths/dark side about micro services

  • We needs lots of micro services 
Before you create any new micro services think about distributed computing because most of the micro services are remote process. First define what "micro" means in problem context it could be lines of code , features or deployment etc

  • Naming micro services will be easy
Computer science has only 2 complex problem and one of them is "naming", very soon you will run out of options when you have 100s of them.

  • Non functional requirement can be done later
Suddenly non function requirement like ( latency, throughput, security, reliability etc) becomes very important from day one.
  • Polyglot programming/persistence or something poly...
Software engineer likes to try latest cutting edge tool so they get carried away by this myth that we can use any language or any framework or any persistence. 
Think about skills and maintenance overhead required for poly.... thing that is added, if you have more than 2/3 things then it is not going to fit in head and you have to be on pager duty.
  • Monitoring is easy
This is one of the most ignored fact about micro services and come as afterthought.
For simple investigation you have to login to many machines , looks in logs , make sure you get the timing right on server etc.

Without proper monitoring tools you can't do this, you need ELK or DataDog type of things.
  • Read and writes are easy 
This thing also get ignored now you are in distributed transaction world and it is not good place to be in and to handle this you need eventual consistent system or non available system.

  • Everything is secure
Now one service is talking to another services using API, so you need good auth system to make sure your system is secure. If you work in financial system then you will be spending more time in answering security related questions.
  • My service will be always up
That will never happen no matter how good programmer or infra you have, service will go down and now you are in Middleware land(Kafka,ActiveMq,ZeroMQ etc) to handle this , so that request can be queued while service was not available.

  • I can add break point to debug it
This is just not possible because now you are in remote process and don't know how many micro services are involved in single request.
  • Testing will be same
Testing is never same as monolithic, you need better automated test to get out of testing hell.
  • No code duplication
As you add more services, code sharing becomes hard because any change in some common code required good testing and to avoid that many team start code duplication.
  • JSON over HTTP
This is one of the biggest myth that all micro services must have Json over Http and it is user facing. 
This has resulted in explosion of REST based API for every micro services and is the reason of why many system are slow because they used text based protocol with no type information.

One thing you want to take away from anti pattern of micro services is that rethink that do you really need Json/REST for every service or you can use other optimized protocol and encoding.
  • Versioning is my grandfather job
Since most of the micro services are remote process , so you have to come with  request/response spec and have to manage version for backward compatibility. 
  •   Team communication remains same.
This is like hidden elephant in room with more services more team communication is required to keep them posted about what is current version, where it is running , what is broken etc.
You can have more silos because no one knows about whole system 

  • Your product is of google/facebook/netflix scale
This is like buy lottery ticket that you are never going to win.


If you can't write decent modular monolithic then don't try micro services because it is all about getting correct coupling and cohesion. Modules should be loosely coupled and high cohesive.

No free lunch with micro services and if you get it wrong then you will be paying premium price :-)


Image result for happy micro services


Thursday 18 October 2018

Setup SSL in Jetty

Have you faced issues when you have to quickly enable SSL and you got stuck with it :-(
You are not alone, i will share my pain and some learning.

I will share steps to enable SSL on jetty.

Warning: Use below instruction only for dev setup and for production contact your security expert !

  • Install jetty on your server

  • Setup some env variable for convenience like

              export jetty_home=.../somejetty
              export jetty_base = .../your_application_install_location

              It is recommended to keep jetty base out side of jetty installation otherwise you will have classpath nightmare 

  • Execute below command to create initial setup for SSL

             java -jar $jetty_home/start.jar --add-to-startd=ssl jetty.base=$jetty_base

        Once you run above command you will see something like below on console.


  •  Add below line  ${jetty.base}/start.d/ssl.ini 
        --module=https

    Check ssl port(jetty.ssl.port) and change it accordingly  

  • Add below line in  ${jetty.base}/start.ini
         jetty.ssl.port=port
         Use same port as ssl.ini file.         

  • Start the server
        java -jar $jetty_home/start.jar jetty.base=$jetty_base


     You are done :-) Jetty starts on ssl .

Magic Questions

     - Which certificate is used by jetty ? 
    That is the magic, jetty ships with certificate that is already imported in keystore that jetty is using.
     Jetty looks for keystore in $jetty_base/etc/keystore location.


    - What is password of keystore

      Key store password is $jetty_base/start.d/ssl.ini , but it is encrypted. You can use below command to get the password.
     java -cp jetty-util-9.2.14.v20151106.jar org.eclipse.jetty.util.security.Password "OBF:1vny1zlo1x8e1vnw1vn61x8g1zlu1vn4" 

     it is "storepwd"

 - How to see what is in key store ? run the below command and enter password
   keytool --list  -v -keystore keystore
     
    If jetty gives some error like password is wrong or tampered then copy the keystore from $jetty_home/etc/keystore to  $jetty_base/etc


   It takes only 5 minutes to perform all the steps but only if you know otherwise it is day long frustration. Enjoy development with jetty.

Sunday 30 September 2018

Anatomy of Apache Spark Job

Apache Spark is general purpose large scale data processing framework. Understanding how spark executes jobs is very important for getting most of it.

Little recap of Spark evaluation paradigm

Spark is using lazy evaluation paradigm in which Spark application does not anything till driver calls "Action".

Lazy eval is key to all the runtime/compile time optimization spark can do with it.
Lazy eval is not new concept it is used in functional programming for decades, data base also uses this for creating logical & physical execution plan.

 Neural network framework like tensorflow is also based on lazy eval, first it builds compute graph and then execute its.


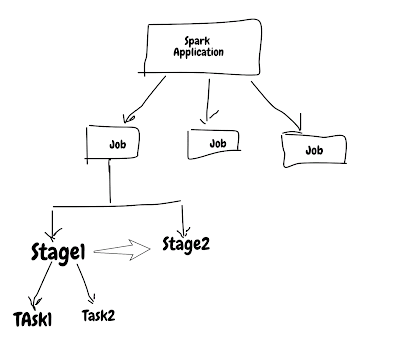
Spark application is made up of jobs , stages & tasks. Jobs & task are executed in parallel by spark but stage inside job are sequential.
Knowing what executes parallel and sequence is very important when you want to tune spark jobs.

Stage are executed in order, so job with many stage will choke on it and also previous stage will feed next stage and it comes with some overhead that involves writing stage output to persistent source(i.e disk, hdfs, s3 etc) and reading it again. This is also called wide transformation/Shuffle dependency.

Job with single stage will be very fast but you can't build any useful application using single stage.

Examples
Lets see some code examples to understand this better.


Spark DAG


This DAG view from spark ui makes it very clear that how Spark sees/execute application.
Above code is creating 3 stage and every stage boundary has some overhead like (Shuffle read/write).
Steps in single stage for eg stage 1 has filter & map merged.

This view also has "Tasks", that is the smallest unit of work that is executed. This application has 2 task per stage.


How spark application is executed
Lets deep dive into how it is executed. Spark application needs 3 component to execute

  • Driver - This submit request to master and coordinate all the tasks. 
  • Cluster Manager - Launches spark executor based on request from driver.
  • Executor  - Executes job and send result back to driver.


2 important component involved in spark application is Driver & Executor, spark job can fail when any of these component are under stress it could be memory/CPU/network/disk.

In next section i will share some of my experience with issues on executor side.
Executor Issues
Each executor needs 2 parameter Cores & Memory.
Cores decided how many task that executor can process and memory is shared between all the cores/task in that executors.

Each spark job has different type of requirement ,so it is anti-pattern to use single config for all the Spark applications.

Issue 1 - Too big task for executor
Executor will fail to process the task or run slow if task is too big to fit in memory.
Few things to look for when this is the issue
  •   Long pause on driver log file( i.e log file not moving)
  •  GC time is too long, it can be verified from "executors" page on spark UI


  • Retry of Stage


  • Executor Log full of "spilling in-memory map" message
2018-09-30 03:30:06 INFO  ExternalSorter:54 - Thread 44 spilling in-memory map of 371.0 MB to disk (6 times so far)
2018-09-30 03:30:24 INFO  ExternalSorter:54 - Thread 44 spilling in-memory map of 379.5 MB to disk (7 times so far)
2018-09-30 03:30:38 INFO  ExternalSorter:54 - Thread 44 spilling in-memory map of 373.8 MB to disk (8 times so far)
2018-09-30 03:30:58 INFO  ExternalSorter:54 - Thread 44 spilling in-memory map of 384.0 MB to disk (9 times so far)
2018-09-30 03:31:17 INFO  ExternalSorter:54 - Thread 44 spilling in-memory map of 382.7 MB to disk (10 times so far)
2018-09-30 03:31:38 INFO  ExternalSorter:54 - Thread 44 spilling in-memory map of 371.0 MB to disk (11 times so far)
2018-09-30 03:31:58 INFO  ExternalSorter:54 - Thread 44 spilling in-memory map of 371.0 MB to disk (12 times so far)

  • Executor log with OOM error
2018-09-30 03:34:35 ERROR Executor:91 - Exception in task 0.0 in stage 3.0 (TID 273)
java.lang.OutOfMemoryError: GC overhead limit exceeded
 at java.util.Arrays.copyOfRange(Arrays.java:3664)
 at java.lang.String.<init>(String.java:207)
 at java.lang.StringBuilder.toString(StringBuilder.java:407)
 at sun.reflect.MethodAccessorGenerator.generateName(MethodAccessorGenerator.java:770)
 at sun.reflect.MethodAccessorGenerator.generate(MethodAccessorGenerator.java:286)
 at sun.reflect.MethodAccessorGenerator.generateSerializationConstructor(MethodAccessorGenerator.java:112)


How to solve this ?

One option that comes quickly is to increase memory on executor side and it works but there will be limit on how much memory you can add to executor side, so very soon you will run out of this option because most of the cluster are shared and it has limit on max memory that can be allocated to executor. 

Next better option is to make individual task small and it is all in your control. This has tradeoff of more shuffle but it is still better than previous one.

Spark UI snapshot for bad run & good run.

Bad Run

Good Run

Second one is with adjusting partition size. Bad run has all the indicator that it needs tuning on partition size.

Issue 2 - Too many cores in executor

This is also also very common problem because we want to overload executor by throwing too many task.
Lets see how to spot if this is issue

  • Time spent on GC on executor side
  • Executor log with message - spilling in-memory map
  • Peak Execution Memory on executor during task execution. This is only available when job is running not on history server.

I will put 2 snapshot from sparkUI

PartitionExecutorCoresMemory
Run 1100242g
Run 1100222g

4 Cores/2 Executor

2 Cores/2 Executor
8 Cores(4*2 Exe) one is busy with GC overhead, with 4 cores(2 * 2 Executor) everything cuts down by half, it is more efficient by using just 4 cores.

If you see pattern like these then reduce executor core and increase no of executors to make spark job faster.

Issue 3 - Yarn memory overhead

This is my favorite and below error confirms that Spark application is having this issue
"ExecutorLostFailure (executor 2 exited caused by one of the running tasks) Reason: Container killed by YARN for exceeding memory limits. 
XXX GB of XXX GB physical memory used. Consider boosting spark.yarn.executor.memoryOverhead"

When ever this error comes most of the developer goes on stack overflow and increase "spark.yarn.executor.memoryOverhead" parameter value.
This is ok option for short term will fail again soon and you will keep on increasing it and finally run out of option.

I think increasing "spark.yarn.executor.memoryOverhead" as anti pattern because whatever memory is specified is added to total memory of executors..
This error means executor is overloaded and best option is try other solution that i mention above.

Spark has so many tuning parameter that some time it looks like siting in plan cockpit.

All the code used in this blog is available @ sparkperformance github repo

Thursday 26 July 2018

Scala Tuple performance

Tuple is very powerful construct in programming language, it allows to create sequence of finite elements.

Elements in tuple can be of different type and very easy to declare like ("something",1,new Date())
Nice thing about tuple is you have to only decided on data type of element not the name.

Computer science has 2 hard problem : Cache invalidation and naming things.

Tuple helps with naming problem.

Nothing comes for free and every thing has some trade off. In this blog i will share dark side of tuple. I will take Scala tuple for example.

What are different ways to implement tuple ?

Class with object array
This is first option that comes to my mind, it is good for flexibility but bad for performance like

  • type checks are expensive
  • and has overhead of array index checking.
  • parameter are of object type so puts memory pressure on both read and write.
  • expensive to make immutable. We will talk about immutable later.
  • no types so serialization will be big overhead

Class with fixed number of parameter.
  This is better than the first one but it also has few issues

  • Parameter are of object type so puts memory pressure
  • Mutable unless framework or library generates code or maintain fixed layout objects like (Tuple, Tuple2, Tuple3...)
  • Serialization overhead due to object type.

Scala is using fixed number of parameter approach.

In absence of Tuple poor man choice was to create class with N number of instance variable and give them proper type, scala has Case class which is based on old school thought.

Lets compare Tuple vs Case class. I will take tuple with 4 parameter and 2 of these are primitive type(Int & Double).

Tuple  : (String,String,Int,Double)
Case class : case class Trade(symbol: String, exchange: String, qty: Int, price: Double)

Structure wise both are same and can be replace each other.

Memory Test

Benchmark create N instance of tuple/case class and putting it in collection and measure memory allocation.


Memory usage for Tuple is double, for 5 Million object tuple takes 384 MB and case class takes just 189 MB.

Read performance test
In this test objects are allocated once and it is accessed to do basic aggregation.


This chart show time taken to do sum on Double value for 1 Million,5 Million etc object.
Read from tuple is slow, it takes double the time.

One thing that is not shown in this chart is memory pressure created during read. Tuple put memory pressure during read.

These numbers shows that Tuple is not good both from memory and cpu usage.
Lets deep dive into the code that is generated for both tuple and case class to understand why we see these numbers.

I will put java code that is generated by Scala compiler.


Scala does well to mark values final so it gets some read efficiency from that but all that is thrown away by creating object type and doing runtime type casting every time value is requested.

Case class code

For caseclass code scala is still using primitive type and that gives all the memory & cpu efficiency .

Spark is very popular large scale data processing framework and lot of production code is written using Tuple.
Tuple based transformation puts lots of load on GC and  has impact on CPU utilization.
Since tuple is all based on Object type so it has effect on network transfer also.

Type info is very important for optimization and that is the reason why Spark 2 is based on Dataset which has compact representation.

So next time looking for quick improvement change Tuple to case class.

Code used for benchmarking is available @ githib

Monday 25 June 2018

Inside Simple Binary Encoding (SBE)


SBE is very fast serialization library which is used in financial industry, in this blog i will go though some of the design choices that are made to make it blazing fast.

Whole purpose of serialization is to encode & decode message and there many options available starting from XML,JSON,Protobufer , Thrift,Avro etc.

XML/JSON are text based encoding/decoding, it is good in most of the case but when latency is important then these text based encoding/decoding become bottleneck.

Protobuffer/Thrift/Avro are binary options and used very widely.

SBE is also binary and was build based on Mechanical sympathy to take advantage of underlying hardware(cpu cache, pre fetcher, access pattern, pipeline instruction etc).

Small history of the CPU & Memory revolution.
Our industry has seen powerful processor from 8 bit, 16 , 32, 64 bit and now normal desktop CPU can execute close to billions of instruction provided programmer is capable to write program to generate that type of load. Memory has also become cheap and it is very easy to get 512 GB server.
Way we program has to change to take advantage all these stuff, data structure & algorithm has to change.


Lets dive inside sbe.

Full stack approach

Most of the system rely on run-time optimization but SBE has taken full stack approach and first level of optimization is done by compiler.


Schema - XML file to define layout & data type of message.
Compiler - Which takes schema as input and generate IR. Lot of magic happen in this layer like using final/constants, optimized code.
Message - Actual message is wrapper over buffer.

Full stack approach allows to do optimization at various level.

No garbage or less garbage
This is very important for low latency system and if it is not taken care then application can't use CPU caches properly and can get into GC pause.

SBE is build around flyweight pattern, it is all about reuse object to reduce memory pressure on JVM.

It has notion of buffer and that can be reused, encoder/decoder can take buffer as input and work on it. Encoder/Decoder does no allocation or very less(i.e in case of String).

SBE recommends to use direct/offheap buffer to take GC completely out of picture, these buffer can be allocated at thread level and can be used for decoding and encoding of message.

Code snippet for buffer usage.

 final ByteBuffer byteBuffer = ByteBuffer.allocateDirect(4096);
 final UnsafeBuffer directBuffer = new UnsafeBuffer(byteBuffer);

tradeEncoder        .tradeId(1)
        .customerId(999)
        .qty(100)
        .symbol("GOOG")
        .tradeType(TradeType.Buy);
   

Cache prefetching

CPU has built in hardware based prefetcher. Cache prefetching is a technique used by computer processors to boost execution performance by fetching instructions or data from their original storage in slower memory to a faster local memory before it is actually needed.
Accessing data from fast CPU cache is many orders of magnitude faster than accessing from main memory.

latency-number-that-you-should-know blog post has details on how fast CPU cache can be.

Prefetching works very well if algorithm is streaming and underlying data used is continuous like array. Array access is very fast because it sequential and predictable

SBE is using array as underlying storage and fields are packed in it.


Data moves in small batches of cache line which is usually 8 bytes, so if application asks for 1 byte it will get 8 byte of data. Since data is packed in array so accessing single byte prefetch array content in advance and it will speed up processing. 

Think of prefetcher as index in database table. Application will get benefit if reads are based on those indexes.

Streaming access
SBE supports all the primitive types and also allows to define custom types with variable size, this allows to have encoder and decoder to be streaming and sequential. This has nice benefit of reading data from cache line and decoder has to know very little metadata about message(i.e offset and size).

This comes with trade off read order must be based on layout order especially if variable types of data is encoded.

For eg Write is doing using below order 
tradeEncoder        .tradeId(1)
        .customerId(999)
        .tradeType(TradeType.Buy)
        .qty(100)
        .symbol("GOOG")
        .exchange("NYSE");


For String attributes(symbol & exchange) read order must be first symbol and then exchange, if application swaps order then it will be reading wrong field, another thing read should be only once for variable length attribute because it is streaming access pattern.

Good things comes at cost!

Unsafe API
Array bound check can add overhead but SBE is using unsafe API and that does not have extra bound check overhead.

Use constants on generated code
When compiler generate code, it pre compute stuff and use constants. One example is field off set is in the generated code, it is not computed.

Code snippet 

     public static int qtyId()
    {
        return 2;
    }

    public static int qtySinceVersion()
    {
        return 0;
    }

    public static int qtyEncodingOffset()
    {
        return 16;
    }

    public static int qtyEncodingLength()
    {
        return 8;
    }

This has trade-off, it is good for performance but not good for flexibility. You can't change order of field and new fields must be added at end.
Another good thing about constants is they are only in generated code they are not in the message to it is very efficient.

Branch free code
Each core has multiple ports to do things parallel and there are few instruction that choke like branches, mod, divide. SBE compiler generates code that is free from these expensive instruction and it has basic pointer bumping math.
Code that is free from expensive instruction is very fast and will take advantage of all the ports of core.
Sample code for java serialization

public void writeFloat(float v) throws IOException {
    if (pos + 4 <= MAX_BLOCK_SIZE) {
        Bits.putFloat(buf, pos, v);        pos += 4;    } else {
        dout.writeFloat(v);    }
}

public void writeLong(long v) throws IOException {
    if (pos + 8 <= MAX_BLOCK_SIZE) {
        Bits.putLong(buf, pos, v);        pos += 8;    } else {
        dout.writeLong(v);    }
}

public void writeDouble(double v) throws IOException {
    if (pos + 8 <= MAX_BLOCK_SIZE) {
        Bits.putDouble(buf, pos, v);        pos += 8;    } else {
        dout.writeDouble(v);    }
}

Sample code for SBE
public TradeEncoder customerId(final long value)
{
    buffer.putLong(offset + 8, value, java.nio.ByteOrder.LITTLE_ENDIAN);    return this;}

public TradeEncoder tradeId(final long value)
{
    buffer.putLong(offset + 0, value, java.nio.ByteOrder.LITTLE_ENDIAN);    return this;}


Some numbers on message size.

Type class marshal.SerializableMarshal -> size 267
Type class marshal.ExternalizableMarshal -> size 75
Type class marshal.SBEMarshall -> size 49

SBE is most compact and very fast, authors of SBE claims it is around 20 to 50X times faster than google proto buffer.

SBE code is available @ simple-binary-encoding
Sample code used in blog is available @ sbeplayground


Saturday 26 May 2018

Custom Logs in Apache Spark

Have you ever felt the frustration of Spark job that runs for hours and it fails due to infra issue.
You know about this failure very late and waste couple of hours on it and it hurts more when Spark UI logs are also not available for postmortem.

You are not alone!

In this post i will go over how to enable your own custom logger that works well with Spark logger.
This custom logger will collect what ever information is required to go from reactive to proactive monitoring.
No need to setup extra logging infra for this.

Spark 2.X is based using Slf4j abstraction and it is using logback binding.

Lets start with logging basic, how to get logger instance in Spark jobs or application.

val _LOG = LoggerFactory.getLogger(this.getClass.getName)

It is that simple and now your application is using same log lib and settings that Spark is based on.

Now to do something more meaningful we have to inject our custom logger that will collect info and write it to Elastic search or Post to some REST endpoint or sends alerts.

lets go step by step to do this

Build custom log appender
Since spark 2.X is based on logback, so we have to write logback logger.

Code snippet for custom logback logger

This is very simple logger which is counting message per thread and all you have to do it override append function.

Such type of logger can do anything like writing to database or sending to REST endpoint or alerting .

Enable logger
For using new logger, create logback.xml file and add entry for new logger.
This file can be packed in Shaded jar or can be specified as runtime parameter.

Sample logback.xml
This config file adding MetricsLogbackAppender as METRICS
<appender name="METRICS" class="micro.logback.MetricsLogbackAppender"/>

Next enabling it for package/classes that should use this
<logger level="info" name="micro" additivity="true">    <appender-ref ref="METRICS" /></logger>
<logger level="info" name="org.apache.spark.scheduler.DAGScheduler" additivity="true">    <appender-ref ref="METRICS" /></logger>

You are done!

Any message logged from 'micro' package or from DAGScheduler class will be using new logger .
Using this technique executor logs can be also capture and this becomes very useful when spark job is running on hundred or thousands of executor.

Now it opens up lots of option of having BI that shows all these message at real time, allow team to ask interesting questions or subscribe to alters when things are not going well.

Caution : Make sure that this new logger is slowing down application execution, making it asynchronous is recommended.

Get the insight at right time and turn it to action

Code used in this blog is available @ sparkmicroservices repo in github.

I am interested in knowing what logging patterns you are using for Spark.