Friday, 11 January 2013

Java Reflection Facts


Java has wonderful feature that allow to inspect any object at run time and extract useful information about it for e.g constructor, methods, fields etc.

Reflection provides flexibility at run time to make decision without writing IF/ELSE, SWITH-CASE, it is used extensively in java and there are lot of framework developed based on it for eg ORM, Rule engine etc

We have to trade off performance for the cost of flexibility that reflections give to us specially if you execute any method via reflection, lets try to measure cost and see what can be done to improve it.


Simple Value Object
Take a simple class Order which has 2 property ( orderId,orderType)


public class Order {
private int orderId;
private String orderType;

public int getOrderId() {
return orderId;
}

public void setOrderId(int orderId) {
this.orderId = orderId;
}

public void setOrderType(String orderType) {
this.orderType = orderType;
}
public String getOrderType() {
return orderType;
}
}


Method Invocation


getOrderId function is called 10 Million time in loop and reflection is around 17X times slow for this test
That is very high cost paid for flexibility!

So what can be done, JDK 1.7 added more feature related to reflection. It is suppose to make life easy for developer by moving lot of plumbing code to java API. 
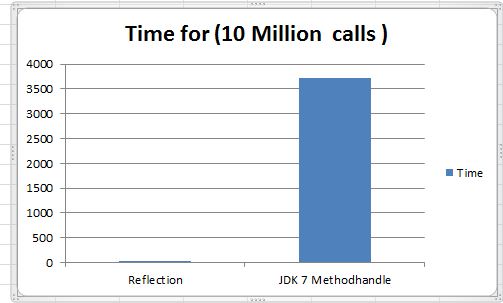
MethodHandles class  is supposed to do all the magic related to reflection use case, Lets try to measure it for our simple case.


Wow it is very very slow 106X times slow compared reflection, i don't want to compare with with normal method call. MethodHandles gives good abstraction for reflection, but on performance side it is very slow, so i am sure you want to re think before you use it.

What are the other options
What are the options to make it fast
 - Go back to normal method call by writing big IF-ELSEIF-ELSE for each method
 - Use some native call to perform reflection.

First option looks such a naive thing, you don't want to write all that and if your class has lot of function then it become nightmare to maintain it. There are some byte code manipulation API that we can use to generate such class. There are couple of options ASMjavassist for that.

May java developer don't want to use second option because you want to stay away from native code due to portability issue, but it is worth trying it to see what type of performance we get. java has Unsafe class which is used internally by java for many things, i will also try to use this to find alternate ways of reflection.

Below is the chart for call of getOrderType 10 Million times

Wow this is some thing, using compiled class ( via javaassit) & Unsafe we can come close to normal method call. I will remove JDK 7 from graph, so that we have some proper scale in graph.


Now it is better, Unsafe is almost same as Normal method. Compiled is better than reflection, it amount 1.8X times faster than reflection.
There are some options to improve performance of "Compiled" class, the current implementation has below code 

        if("getOrderType".equals(s))
            return (String)((com.atomic.RefTest.Order)obj).getOrderType();
        if("getOrderId".equals(s))
            return Integer.valueOf(((com.atomic.RefTest.Order)obj).getOrderId());

There are if condition for making decision which method to call, if we can remove that we might get some performance improvement, so now it will look like 

((com.atomic.ReflectionTest.Order)obj).getOrderType();

Below is graph with that change - CompiledSingleProp is one with no IF condition 

Performance of CompiledSingleProp is similar to Unsafe and close to Normal function call.
So we can definitely use "Option 1" for reflection without significant performance impact on application.

Performance compare Object vs primitive property
While doing this test i notice performance of primitive property is slow as compared to object property and reason is because we have to create Wrapper class to represent primitive type and it adds overhead.
Below is graph for comparing primitive vs object property
  

Compiled class performs better in case of object and it is slow for primitive type(int/float/long), but Unsafe performance has not effect on type of property, so based on use case proper alternate solution can be used to get best performance.

Conclusion
There are many alternate of reflection available, this post talks about few. Compiled class & Unsafe are the most efficient way to perform property get/set calls. These options should be consider if your application is using reflections heavily. Lot of professional tools uses's compiled property. 

About Sample Code

Code available @ github 
For unsafe i am not generating any code, it can easily done using logic similar to PropertyGenerator 


 Java Reflection Example

Sunday, 30 December 2012

My New Year Resolution

I am sure you have asked this question to your self as end of year of near. I am not sure about others but i make sure that whatever is set as NEW YEAR RESOLUTION is never achieve and reason is very simple because i am not motivated towards my goals, it just set for namesake.

Some of my examples are 
 - Loosing some weight.
 - Managing my to do list.
 - Better financial planning.
 - Better work & life balance etc.

By seeing the above list you can easily make up why these goals were never achieved!

In 2013 i really wanted to do something and for that i have to become pragmatic, so i thought lets create the list of things that i don't want to do. As we know there are hell lot of things that you should not do but creating that list will be like counting starts in sky,we need few items that we can count on finger. This is going to be difficult, so i was confused.

There are few people in world to whom you can always look up for suggestion and no body is better than your parents.So i referred to diary that my father used to give me on every birthday without fail.

I want to list down some of the "DO NOT LET" things that he wanted to me understand and really put that in action.

DO NOT LET - Advice from my father

 - Do not let your wisdom to rest
 - Do not let your money to rest
-  Do not let your mind to rest
-  Do not let your intellect to rest
-  Do not let your learning to rest
-  Do not let your good habits to rest
-  Do not let your efforts to rest
-  Do not let your Hands & Legs to rest
-  Do not let your financial activities to rest
-  Do not let your feelings to rest
-  Do not let your desire to rest

Because it is not only the process of rusting but also brings stagnation & complacency and full-stop  which is the end. Never be satisfied with your achievement , knowledge & learning. It motivates you to achieve more and more..........more

Conclusion
Once you know what you should not do then it become bit easy to focus.In 2013 i will try to meet minimum 2 "DO NOT LET" items from my father list and may be i have to do self retrospective to see how i did.

Wish you happy new year
   

Tuesday, 25 December 2012

Are you using correct logging framework ?

Logging framework is heart of every application, it helps in troubleshooting production issue,knowing how your application is being use,what are bottle neck in application and may more.

Using right logging framework is key, Wikipedia has list of famous one in java world.

So logging has lot of benefit  but it also brings lot of overhead ,so you do trade-off for benefit that you get. It is interesting to measure cost of overhead and we all know it has big overhead because it is I/O bound, so we come with best strategy on what to log, how much to log, which one is best framework etc.

One problem with current logging framework is that it , not much work has been done on performance improvement, especially if you talk about taking advantage of multi core architecture. Application try to do more work to take advantage of multiple cores and that may result into more..... log message and since log framework are not their yet, so they don't scale.

Cost Of Log Message

Lets measure time spent in logging. 
I wrote java program that sums the number of element in array and it is done in parallel. Array is divided in chunk and each task sums that chunk and log message before & after it process chunk. I have taken simple computation problem because we want to measure cost of logging.

For bench marking purpose , i do calculation with/without logging to check how much time we spend on logging and numbers are crazy.

Java JDK 1.4 logging framework(java.util.logging) is used  for benchmark, i only took java one because all other like log4j , apache logging , SLFJ etc are almost same when they log message to file.

Details of Machine
OS : Windows 7, 64 bit
Processor : Intel i5, 2.40 GHz
No Of Cores : 4 


Numbers are really crazy, once you add logging, performance drops by 6X to 10X times, it is not worth it to use logging.

More time is spent in logging than doing real work, but fact of life is we still need logging and if it is not there then it will be nightmare to troubleshoot production issue.

Why it is so slow!
To find out why is super slow, we have to dive into the code, so lets have look at default handler(FileHandler) that java logging framework provides.

FileHandler has synchronized function that perform core logging and we know what type of performance degradation you can get in multi threaded env, so that is number 1 reason for slowness.

public synchronized void publish(LogRecord record) {
        if (!isLoggable(record)) {
            return;
        }
        super.publish(record);
        flush();
       .........
      ..........
      ...........
    }


Other reason for slowness is that I/O operation is performed for each and every call of log message, there is no buffering done, not sure why it is done like that may be to keep it simple and all these simplicity adds to performance cost. 

All of these techniques result in lot of contention and we see big degrade in performance by harm-less looking code.

 What can we do now ?
So we have to find some alternate framework that does't make our application 10X times slow!
 We have to do couple of quick things.
 - Get rid of synchronized
 - Try to add some I/O buffering
 - Use Async for logging

So i did add these stuff and created simple logging util and measured the cost of same.

So the light green one is the logger that has some of improvement and it is amazing to see that we are back to same performance and it is not adding any significant overhead, it is almost as there is no logging in code.

So by just switching logging framework we can get up to 6X to 10X benefit.

What gives up these performance improvement
  - ConcurrentLinkedQueue is used to store all the log message, ConcurrentLinkedQueue is lock free queue but it is not bounded. Bouded queue can be used to reduce risk where producer is faster than consumer.

   - Buffering is added for I/O operation, these reduces I/O operation

   - Prealocated bytebuffer is used to keep all the message that needs to writen to file.

  - Lock based wait strategy is used when there is no message in queue, better waiting strategy can be used based on requirement, but for logs i think lock based are fine.

Conclusion 
So time has come to re-think logging framework used, just using by using correct logging framework we can get big performance boost. To make application more responsive, we have to have to look for alternate. This is very important in low latency & high throughput space.

Example that i used is very basic, it does't have all the features, but can be easily extended to add those stuff. 


Link To Code
Code available @ github

Friday, 30 November 2012

Lock Free bounded queue

Lock free bounded queue

JDK 1.5 was first step towards adding serious concurrency support to java, it changed  the way you write concurrent program and in other version 1.6, 1.7 etc more concurrency support. 

One of the important building block for concurrent programming is Queue, java has lot of them ArrayBlockingQueue, ArrayDeque, ConcurrentLinkedQueue, DelayQueue, LinkedBlockingDeque, LinkedBlockingQueue, PriorityBlockingQueue, PriorityQueue, SynchronousQueue.
I am sure you will find one Queue that will fit your need!

Locks are used in most of the queue for managing concurrent access to data structure because of obvious reason of simplicity to use, lock based strategy makes it difficult to develop low latency system, it could result in priority inversion, context switching, deadlock etc 
Alternate way is using Non Blocking Algorithm , which is bit difficult to develop, one of the non blocking algorithm is lock free algorithm

Java added support for look free via java.util.concurrent.atomic package, so now time for some action with lock free api.

Java 1.5+ has lock free queue ConcurrentLinkedQueue, which is very fast but it is unbounded and such type queue can be very risky to use real application because most of the time queue is not balanced, it is either full or empty and if it is unbounded then system can run out of resource.

I will implement lock free bounded queue and measure it performance against lock based bounded queue(ArrayBlocking), lock free unbounded queue(ConcurrentLinkedQueue). I chose these queue because they are fastest queue available in JDK.

Number Game


  Test Envinorment Details
  OS : Windows 7, 64 bit
  Processor : Intel (R) Core(TM) i7-2820QM CPU @ 2.30 GHz
  Processor Arch : Sandy Bridge , 4 physical cores/8 threads

  For this test 10 Million message was added to queue using single producer and consumer number are in range of 1 to 5, non blocking call(offer/poll) call is used to produce/consume message from queue, performance is best when there is 1 consumer and as number of consumer increase performance degrades, so it is evident that contention is the culprit. 

  Cpu Usage

Cpu usage for LockFreeBoundedQueue


Cpu usage for ArrayBlockingQueue

From CPU usage it is clear that contention is causing drop in cpu usage and with lock free queue CPU usage is in acceptable range.

Test Code of LockFreeBoundedQueue

Link To Code

Above code is just an idea to demonstrate that how powerful non blocking algorithm can be. This code can be enhanced to add more feature like multiple producer, support for blocking call put/take.
Before adding blocking support(put/take) to queue we have to think about blocking strategy, there are couple of option spinning, hybrid spinning etc.


Saturday, 3 November 2012

Latency number that you should know

Latency number that you should know

Many of you work on low latency & high throughput system. Key to developing such system is understanding latency be it of cpu cache, Ram, disk or network. I found some interesting latency number, understanding these number is very important because all these are based on speed of light and we all know that we will never be able to get faster than light. 

L1 cache reference ......................... 0.5 ns
Branch mispredict ............................ 5 ns
L2 cache reference ........................... 7 ns
Mutex lock/unlock ........................... 25 ns
Main memory reference ...................... 100 ns             
Compress 1K bytes with Zippy ............. 3,000 ns  =   3 µs
Send 2K bytes over 1 Gbps network ....... 20,000 ns  =  20 µs
SSD random read ........................ 150,000 ns  = 150 µs
Read 1 MB sequentially from memory ..... 250,000 ns  = 250 µs
Round trip within same datacenter ...... 500,000 ns  = 0.5 ms
Read 1 MB sequentially from SSD* ..... 1,000,000 ns  =   1 ms
Disk seek ........................... 10,000,000 ns  =  10 ms
Read 1 MB sequentially from disk .... 20,000,000 ns  =  20 ms
Send packet CA->Netherlands->CA .... 150,000,000 ns  = 150 ms

CPU Cache latency cost


L1 cache is nearest to core and as you move away you can see that latency is taking hit and if you are doing it billion times then it is going to get converted to human noticeable delay, here is what it will look like.

Minute

L1 cache reference                  0.5 s         One heart beat (0.5 s)
Branch mispredict                   5 s           Yawn
L2 cache reference                  7 s           Long yawn
Mutex lock/unlock                   25 s          Taking couple of deep breath.

Hour

Main memory reference               100 s         Answering nature call

Week

Read 1 MB sequentially from memory  2.9 days      Welcome long weekend

So to get better performance you have to try to come close to L1/L2 cache which is really difficult things to do. You have develop Cache oblivious algorithm to get super performance.

I/O latency cost

Read 1 MB sequentially from disk .... 20,000,000 ns  =  20 ms
Read 1 MB sequentially from SSD(~1GB/sec) ..... 1,000,000 ns  =   1 ms


So for normal disk on an average can read 50 MB/Sec

For SSD 1000 MB/Sec

50 MB/Sec is pretty fast and there are many techniques by which you can increase sequential  read more by adjusting buffer size of read, so before making decision on what type of disk you use, you should make sure are you able to process data at the rate it is read from normal Disk. If you can’t process as fast as that then no point in getting SSD disk.

Reference


Friday, 2 November 2012

Power of Java MemoryMapped File

Power of Java MemoryMapped File


In JDK 1.4 interesting feature of Memory mapped file was added to java, which allow to map any file to OS memory for efficient reading. Memory mapped file can be used to developed  IPC type of solution. This article is experiment with memory mapped file to create IPC.

Some details about Memory Mapped File, definition from WIKI


A memory-mapped file is a segment of virtual memory which has been assigned a direct byte-for-byte correlation with some portion of a file or file-like resource. This resource is typically a file that is physically present on-disk, but can also be a device, shared memory object, or other resource that the operating system can reference through a file descriptor. Once present, this correlation between the file and the memory space permits applications to treat the mapped portion as if it were primary memory.


Sample Program

There are two java program one is writer and other is reader. Writer is producer and tries to write to Memory Mapped file , reader is consumer and it reads message from memory mapped file. This is just a sample program to show to idea, it does't handle many edge case but good enough to build something on top of memory mapped file.

MemoryMapWriter


import java.io.File;
import java.io.FileNotFoundException;
import java.io.IOException;
import java.io.RandomAccessFile;
import java.nio.MappedByteBuffer;
import java.nio.channels.FileChannel;

public class MemoryMapWriter {

public static void main(String[] args) throws FileNotFoundException, IOException, InterruptedException {
File f = new File("c:/tmp/mapped.txt");
f.delete();
FileChannel fc = new RandomAccessFile(f, "rw").getChannel();
long bufferSize=8*1000;
MappedByteBuffer mem =fc.map(FileChannel.MapMode.READ_WRITE, 0, bufferSize);
int start = 0;
long counter=1;
long HUNDREDK=100000;
long startT = System.currentTimeMillis();
long noOfMessage = HUNDREDK * 10 * 10;
for(;;)
{
if(!mem.hasRemaining())
{
start+=mem.position();
mem =fc.map(FileChannel.MapMode.READ_WRITE, start, bufferSize);
}
mem.putLong(counter);
counter++;
if(counter > noOfMessage )
break;
}
long endT = System.currentTimeMillis();
long tot = endT - startT;
System.out.println(String.format("No Of Message %s , Time(ms) %s ",noOfMessage, tot)) ;
}

}