Sunday, 16 June 2013

Fast ReadWrite Lock


Locks are bad for performance, but still they are good fit for some scenario.

In this post i will review java Read/Write lock and alternate implementation of fast Read/Write lock 

What is Readers-Writer lock
Lets do quick re-cap of read/write lock.

As name suggest it is shared lock , it is shared between readers/writers. So you can have either reader(s) or writer. You can have multiple readers or one writer active at any given point of time. So it is very good fit for the case where number of read operation is more than write.

What is the issue with Java RW lock
By design only reader(s) or writer can be active at any given point of time, so it will cause starvation when contention is high

Advance RW lock will have additional features like
  • Priority -   for eg writer has more priority than readers or otherwise
  • Fairness  - This can be based on waiting time
It is complex to build lock with these set of rules and many things are in control of OS, for eg scheduling of thread.
With all these issues rw locks are still used.

How does RW lock perform.
Lets try to measure rw lock performance under different scenario

Details of problem that will be used for testing

Read/Write to Hashmap, writer threads adds 1 Million entry to map and reader tries to read those value back, for write operation Write lock is used and for read operation Read lock is used.
I will try to test java rw lock under no-contention and gradually try to increase contention to see how it performs.

Legend to read graph

1W - One writer
1W-1R - One writer & One reader
1W-2R - One write & Two reader 

Writer Performance


X Axis - Writer/reader Threads
Y Axis - Time to 1 Milli entry


Case when there is "1 Writer & 1 Reader" shows wired number on my system, i will ignore that for comparison.

When there is no contention writer takes around 73 ms and as we add more reader threads contention increases, it starts to slow down, in my example when total thread count reaches to 4 performance drops by 10 times. That is big drop for "1Writer-3Reader" scenario, just think what will happen if more readers are added.

Writer Throughput
Lets have look at throughput


X Axis - Writer/reader Threads
Y Axis - Throughput/Sec


I will ignore case "1W-1R" 

Throughput also takes big hit under contention, it falls from sky to roof, for 1 writer throughput is 14 million and once total thread count reaches to 4 throughput drops to 1.4 million which is 90% less.

Writer is just one part of RW lock, lets look at  the performance of reader.

Reader Performance

X Axis - Writer/reader Threads
Y Axis - Time to add 1 Million entry


Performance degrade trend continues in readers also.

Reader Throughput

Reader throughput also takes hit under contention.


Readers without writer contention
This scenario is very realistic because 

  • Mostly writer thread will populate data at application start up time
  • Or based on some write event to update data incrementally

90% + times application only reads the data and it is the performance of readers threads that will matter most by the end of day. Lets have look at performance when only readers are active.


In this test data in hashmap was pre-populated and only readers threads were executing.
Numbers now looks real :-) . 

It takes more time to read data as number of readers increase, same thing is observed for throughput also, it drops.

Alternate Reader/Writer Lock
Lets compare alternate implementation of RW lock

Readers without writer contention

Fast Lock outperforms java ReadWriteLock in both the test. 

In the first test, time taken to read is almost flat with Fast RW Lock and for java based it is going up like stock price as we keep on adding more readers thread. 

In throughput test java rw lock starts from 28 million and it drops to 1.6 million, that is 95% drop.
Fast rw lock starts from 58 million and drops to 34 million, that is around 40% drop.

Under heavy contention(i.e 4 readers), java readerwriter lock is around 20X times slow, that looks like comparing apple vs orange, but test result shows that.

So for readers new lock looks great, lest measure with writer.

 Writer Performance - Java RW vs Fast RW

Fastlock performs better than java RW lock under contentions 

Reader Performance - Java RW vs Fast RW


What makes FastRW lock fast
Now lets understand why new read/write lock is fast.

RW lock that i have used for testing is an implementation of SeqLock. SeqLock is very common in linux world, it provide parallelism for readers & writer. Reader never blocks writer & reader uses optimistic approach to read the data.

Readers in seqlock never update any sate in ReadWrite lock and thus reduces cpu cache traffic,so just load operation is involved for reading data.

So in nutshell it provides 

  • Less cpu cache traffic  
  • Readers never block writer
  • Reader never changes state of lock, no expensive store operation
  • Readers can slow down if write frequency is very high
  • Writer always get priority 


With so much of benefit i am sure you will never use java RW lock!

Conclusion 
SeqLock are very good alternative for reader/writer lock and especially in multicore world where we are use new technique to get best out of processor. Someday java will add support for seqlock.
Code is available @ GitHub for your reference.

Sunday, 9 June 2013

CPU cache access pattern

Things to know about low latency

If you are developing low latency application then you have to remove bottleneck that can cause your latency to increase, some of the bottleneck that comes to my mind

 - Input/Output - I/O has big effect in latency it will cause CPU to stall. SSD disk may be one option, but still you want to keep this out of core processing logic.

 - Network - Same effect as I/O, so you have to reduce Network read/write in your core logic, there are many software and hardware solution to improve this.

- Locks in code - Using non-blocking techniques.

- Keeping data in RAM - I will explore this option in blog.

So we can keep all data in RAM to get best latency possible. RAM is very cheap, so lets put every thing in RAM. In theory you should be able to keep CPU busy if all the data that you need for computing is available in RAM, but in practical it doesn't happen that way because of underlying datastructure used.
CPU stalls for some time due to slow access of RAM.

Experiment
Lets try simple experiment to prove that keeping all data in RAM is just not enough to achieve low latency.

Problem:
25 million instrument object are stored in memory and each object has 2 attribute
 - Instrument Id
 - Price 
Sets of input price is passed as input and all the instrument matching that price will be returned. It is a simple search based on price attribute.

Structure Of Instrument Object
Two types of instrument object is created for this test.

 - As simple java object
Instrument object is simple java class with 2 attribute

 class Instrument
{
public int id;
private int price;
public Instrument(int id, int price) {
super();
this.id = id;
this.price = price;
}

public int getId() {
return id;
}

public int getPrice() {
return price;
}
}

- Column type object
For each attribute array is created, this structure is more CPU cache friendly, we will why is is so later.
Sample ColumnInstrument Object

 class ColumnInstrumentStore
{

private int[] ids;
private int[] prices;

public ArrayInstrumentStore(int size)
{
ids = new int[size];
prices = new int[size];
}


public int getId(int index) {
return ids[index];
}


public int getPrice(int index) {
return prices[index];
}
public void setValue(int index, int id, int price) {
ids[index] = id;
prices[index] = price;
}

}

Lets measure performance
Lets try to measure search cost for 2 types of instrument object,

 X axis - No of reading
 Y axsis - Time taken in Ms

Linear search is performed on 25 million instrument object.
Instrument object defined as column is around 5% to 25% faster as compared to normal java based instrument object, on average it is 15% faster as compared to java based object.

Lets look at another number - Time take for each iteration. Time taken for 1 iteration is very less so i have used nano second to measure that.


 X axis - No of reading
 Y axis - Time taken in NanoSecond

This explains why search on column based objects is fast, time spent per iteration is around 15% less .

Why Column based object is fast
Lets look at the reason why search performs better on Column layout type of object as compared to normal object.

 - CPU Pre-Fetching - Today almost all the processor supports hardware pre-fetch. CPU pre-fetch data that is required by application to reduce memory latency

 - Better use of CPU cache - CPU moves data from main memory to cache via cache lines, in current generation of CPU, cache line is of 64 byte, so if you ask for 1 byte of data, processor will still bring 64 byte of data from ram to CPU cache line. This is called - Spatial locality, definition from wikipedia -

Spatial locality: if a particular memory location is referenced at a particular time, then it is likely that nearby memory locations will be referenced in the near future. In this case it is common to attempt to guess the size and shape of the area around the current reference for which it is worthwhile to prepare faster access

This CPU behavior can be used to reduce round trip to ram by co-locating you data.

Lets take Instrument object to understand layout

- Object Layout


- Column Layout


In case of column based instrument, data is stored in integer array, if program request for single value of array , it will get next 15 element of array due to cache line transfer, but in case of normal object it will get only 7 instrument price.
Normal object layout requires double round trip to memory and that is the reason why it is slow.
If you co locate your objects then you can use CPU cache much more efficiently.

Most of the real object are more complex than Instrument object that i have used and you can imagine number of round trip it require to RAM.
You can get more details of memory latency from latency-number-that-you-should-know
Just to put those number in context -

L1 Cache : 0.5 ns
Main Memory  : 100 ns ( 20x times more than L1)


How it performs in multi-threaded world.
In today's time it is impossible to get machine with single core, we live in multi core world!
Each logical core has its own private cache, so if you data structure is cache friendly then it will scale linearly as you add more threads/core to your processing.

Lets look at some number for multi threaded search.

Search latency


Loop Iteration

Both search & iteration per second is improving as more number of threads are added, this will become more effective for NUMA machines because memory access is not uniform.

Just by having CPU cache friendly layout you can improve application performance
Column layout have more benefit, more on next blog.

Sunday, 19 May 2013

Lock Less Java Object Pool

It is being while i wrote anything, i has been busy with my new job that involve doing some interesting work in performance tuning. One of the challenge is to reduce object creation during critical part of application.

Garbage Collection hiccups has been main pain point in java for some time, although java has improved over time with GC algorithmic. Azul is market leader developing pause less GC but Azul JVM are not free as speech!

Creating too many temporary/garbage object does't work too well because it create work for GC and it is going to have effect on latency, too much garbage also does't work well with multi core system because it causes cache pollution.

So how should we fix this ?

Garbage less coding
This is only possible if you know how many object you need upfront and pre-allocate them, but in reality that is very difficult to find that , but in-case if you still managed to do that then you have to worry about another issue

  • You might not have enough memory to hold all the object you need
  • You have to handle concurrency
So what is the solution for above problem
There is Object Pool design pattern that can address both of the above issue,it lets you to specify num of object that you need in pool and handles concurrent request to serve object request.

Object Pool has been base of many application that has low latency requirement, flavor of object pool is Flyweight design pattern.

Both of above pattern will help us in avoiding object creation, that is great so now GC work is reduced and in theory our application performance should improve but in practical does't happen that way because Object Pool/Flyweight has to handle concurrency and  whatever advantage you get by avoiding object creation is lost because of concurrency issue.

What are most common way to handle concurrency
Object pool is typical producer/consumer problem and it can be solved by using following techniques 

Synchronized - This was the only way to handle concurrency before JDK 1.5, apache has written wonder full object pool API based on synchronized 

Locks   - Java added excellent support for concurrent programming since JDK 1.5, there has been some work to use Locks to develop Object Pool for eg furious-objectpool

Lock Free - I could not find any implementation that is built using fully lock free technique, but furious-objectpool use mix of ArrayBlocking queue & ConcurrentLinked queue

Lets measure performance
In this test i have created pool of 1 Million object and those object are accessed by different pool implementation, objects are taken from pool and return back to pool.

This test first starts with 1 thread and then number of threads are increased to measure how different pool implementation perform under contention


.
X Axis - No Of Threads
Y Axis - Time in Ms - Lower time is better

This test include pool from Apache, Furious Pool & ArrayBlocking based Pool

Apache one is worst and as number of threads increase performance degrades further and reason for same is Apache pool is based on heavy use of "synchronized" 

Other two Furious & ArrayBlocking based pool performs better but both of them also slows down as contention increase. 

ArrayBlocking queue based pool takes around 1000 ms for 1 Million items when 12 threads are trying to access the pool, Furious pool which internally uses Arrayblocking queue takes around 1975 ms for same thing. 

I have to do some more detail investigation to find out why Furious is taking double time because it is also based on ArrayBlocking queue.

Performance of arrayblocking queue is decent but it is lock based approach, what type of performance we can get if we can implement lock free pool.

Lock free pool.
Implementing lock free pool is not impossible but bit difficult because you have to handle multiple producer & consumer.

I will implement hybrid pool which will use lock on the producer side & non blocking technique on the consumer side.

Lets have look some numbers 

I performed same test with new implementation (FastPool) and it is almost 30% faster than ArayBlocking queue.

30% improvement is not bad, it can definitely help is meeting latency goal.

What makes Fast Pool fast!
I used couple of technique to make it fast
  • Producer are lock based - Multiple producer are managed using locks, this is same as Array Blocking queue, so nothing great about this.


  • Immediate publication of released item - it publishes element before lock is released using cheap memory barrier. This gives some gain


  • Consumer are non blocking - CAS is used to achieve this, consumer are never blocked due to producer. Array Blocking queue blocks consumer because it use same lock for producer & consumer


  • Thread Local to maintain value locality -  Thread Local is used to acquire last value that was used, this reduces contention to great extent. 
If you are interested in having look at code then it is available @ FastObjectPool.java 

Monday, 18 February 2013

Experiment with ConcurrentHashmap

I am investigating memory issue in one of my recent project where data is kept in memory for fast access, but memory footprint of application is very high.
This application was heavily using CHM(i.e Concurrenthashmap), so no brainier guess was required that CHM was the issue. I did memory profiling session to find how much really CHM was taking.
I was surprised with result that CHM was taking around 50% of the memory. So it was confirmed that CHM was the issue, it is fast but not memory efficient.

Why CHM is so fat ?

  • Key/Values are wrapped by Map.Entry object , this create extra object per object. 
  • Each segment is Re-entrant lock, so if you have lot of  small CHM and concurrency level is default then there will be lot of lock object and that will come in top list. 
  • and many more states for house keeping activities.


All of above objects makes very good contribution to memory.

How can we reduce memory footprint
If is difficult to reduce memory footprint of CHM and possible reason that i can think of are

  • It has to support old interface of Map 
  • hash code collision technique used by java map are closed, closed hashing is based on creating Linklist on collision, closed hashing is very fast for resolution, but it is not CPU cache friendly, especially if nodes turns in big link list. There is interesting article about LinkList problem 


So we need alternate CHM implementation which is memory efficient.

Version 2 of CHM

I started to create version of CHM which has low memory foot print, target is come a close as array. I also used alternate hash code collision techniques to check the performance, their many options for Open_addressing.
I tried below options.

  • Linear probing - performance was not that great, although this is most cpu cache friendly. Need to spend some more time to get it right.
  • Double_hashing - Performance was in acceptable range.

Lets measure CHM V2 

  • Memory footprint


There is big gain in terms of memory, CHM takes around 45%+ more than raw data , new implementation LCHM is very much close to Array type.

  • Single thread PUT performance

CHM out performs in PUT test, new implementation is around 50 to 80 Millisecond slower for 1 Million items. 50 to 80 ms is not noticeable delay and i think it is good for application where latency requirement is  in seconds and in case if latency requirement is in millisecond/nanosecond then any way CHM will not be good choice.
Reason for slow performance of LCHM is hash collision technique, double hashing is used for resolving has code collision. 

  • Concurrent Add performance 


New implementation perform slightly better when multiple threads are used to write to map.
  • Get Performance

 Performance of get is slightly slower as compared to CHM.

Conclusion

New implementation out performs in memory test and it is bit slow in in get/put test, there are couple of things that can be done to improve performance of get/put and all the performance difference that we see is due to probing technique used.
  •  Probing technique can be improved, linear probing technique can used to to get cache friendly access. 
  • It is very easy to make probing technique parallel. 

Friday, 11 January 2013

Java Reflection Facts


Java has wonderful feature that allow to inspect any object at run time and extract useful information about it for e.g constructor, methods, fields etc.

Reflection provides flexibility at run time to make decision without writing IF/ELSE, SWITH-CASE, it is used extensively in java and there are lot of framework developed based on it for eg ORM, Rule engine etc

We have to trade off performance for the cost of flexibility that reflections give to us specially if you execute any method via reflection, lets try to measure cost and see what can be done to improve it.


Simple Value Object
Take a simple class Order which has 2 property ( orderId,orderType)


public class Order {
private int orderId;
private String orderType;

public int getOrderId() {
return orderId;
}

public void setOrderId(int orderId) {
this.orderId = orderId;
}

public void setOrderType(String orderType) {
this.orderType = orderType;
}
public String getOrderType() {
return orderType;
}
}


Method Invocation


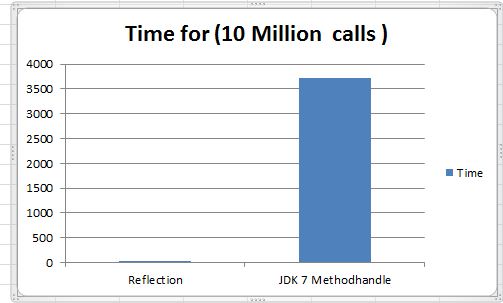
getOrderId function is called 10 Million time in loop and reflection is around 17X times slow for this test
That is very high cost paid for flexibility!

So what can be done, JDK 1.7 added more feature related to reflection. It is suppose to make life easy for developer by moving lot of plumbing code to java API. MethodHandles class  is supposed to do all the magic related to reflection use case, Lets try to measure it for our simple case.


Wow it is very very slow 106X times slow compared reflection, i don't want to compare with with normal method call. MethodHandles gives good abstraction for reflection, but on performance side it is very slow, so i am sure you want to re think before you use it.

What are the other options
What are the options to make it fast
 - Go back to normal method call by writing big IF-ELSEIF-ELSE for each method
 - Use some native call to perform reflection.

First option looks such a naive thing, you don't want to write all that and if your class has lot of function then it become nightmare to maintain it. There are some byte code manipulation API that we can use to generate such class. There are couple of options ASMjavassist for that.

May java developer don't want to use second option because you want to stay away from native code due to portability issue, but it is worth trying it to see what type of performance we get. java has Unsafe class which is used internally by java for many things, i will also try to use this to find alternate ways of reflection.

Below is the chart for call of getOrderType 10 Million times

Wow this is some thing, using compiled class ( via javaassit) & Unsafe we can come close to normal method call. I will remove JDK 7 from graph, so that we have some proper scale in graph.


Now it is better, Unsafe is almost same as Normal method. Compiled is better than reflection, it amount 1.8X times faster than reflection.
There are some options to improve performance of "Compiled" class, the current implementation has below code 

        if("getOrderType".equals(s))
            return (String)((com.atomic.RefTest.Order)obj).getOrderType();
        if("getOrderId".equals(s))
            return Integer.valueOf(((com.atomic.RefTest.Order)obj).getOrderId());

There are if condition for making decision which method to call, if we can remove that we might get some performance improvement, so now it will look like 

((com.atomic.ReflectionTest.Order)obj).getOrderType();

Below is graph with that change - CompiledSingleProp is one with no IF condition 

Performance of CompiledSingleProp is similar to Unsafe and close to Normal function call.
So we can definitely use "Option 1" for reflection without significant performance impact on application.

Performance compare Object vs primitive property
While doing this test i notice performance of primitive property is slow as compared to object property and reason is because we have to create Wrapper class to represent primitive type and it adds overhead.
Below is graph for comparing primitive vs object property
  

Compiled class performs better in case of object and it is slow for primitive type(int/float/long), but Unsafe performance has not effect on type of property, so based on use case proper alternate solution can be used to get best performance.

Conclusion
There are many alternate of reflection available, this post talks about few. Compiled class & Unsafe are the most efficient way to perform property get/set calls. These options should be consider if your application is using reflections heavily. Lot of professional tools uses's compiled property. 

About Sample Code

Code available @ github 
For unsafe i am not generating any code, it can easily done using logic similar to PropertyGenerator 


 Java Reflection Example

Sunday, 30 December 2012

My New Year Resolution

I am sure you have asked this question to your self as end of year of near. I am not sure about others but i make sure that whatever is set as NEW YEAR RESOLUTION is never achieve and reason is very simple because i am not motivated towards my goals, it just set for namesake.

Some of my examples are 
 - Loosing some weight.
 - Managing my to do list.
 - Better financial planning.
 - Better work & life balance etc.

By seeing the above list you can easily make up why these goals were never achieved!

In 2013 i really wanted to do something and for that i have to become pragmatic, so i thought lets create the list of things that i don't want to do. As we know there are hell lot of things that you should not do but creating that list will be like counting starts in sky,we need few items that we can count on finger. This is going to be difficult, so i was confused.

There are few people in world to whom you can always look up for suggestion and no body is better than your parents.So i referred to diary that my father used to give me on every birthday without fail.

I want to list down some of the "DO NOT LET" things that he wanted to me understand and really put that in action.

DO NOT LET - Advice from my father

 - Do not let your wisdom to rest
 - Do not let your money to rest
-  Do not let your mind to rest
-  Do not let your intellect to rest
-  Do not let your learning to rest
-  Do not let your good habits to rest
-  Do not let your efforts to rest
-  Do not let your Hands & Legs to rest
-  Do not let your financial activities to rest
-  Do not let your feelings to rest
-  Do not let your desire to rest

Because it is not only the process of rusting but also brings stagnation & complacency and full-stop  which is the end. Never be satisfied with your achievement , knowledge & learning. It motivates you to achieve more and more..........more

Conclusion
Once you know what you should not do then it become bit easy to focus.In 2013 i will try to meet minimum 2 "DO NOT LET" items from my father list and may be i have to do self retrospective to see how i did.

Wish you happy new year